Silver Market Update - At A Critical Juncture Here


Much of what is written in the parallel Gold Market Update is equally applicable to silver and it will not be repeated here.
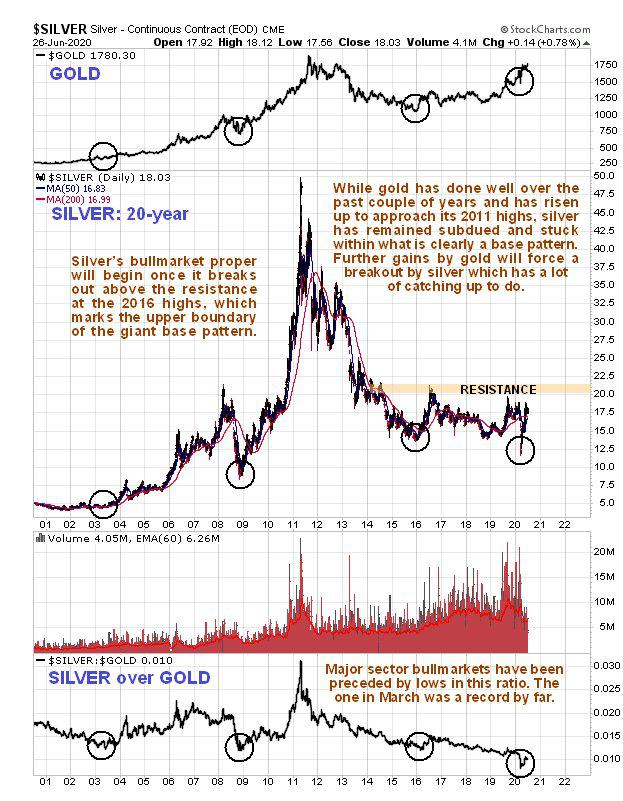
Although silver has picked up significantly since its March low it has greatly underperformed gold over the past 2 years, but this is normal during the earliest stages of a major sector bullmarket when gold is favored over silver. On its 20-year chart we can see that silver remains stuck within a giant base pattern that started to form as far back as 2013. This chart makes clear that once gold breaks out to new highs against the dollar, then silver should break out of this base to enter a dynamic advancing phase.
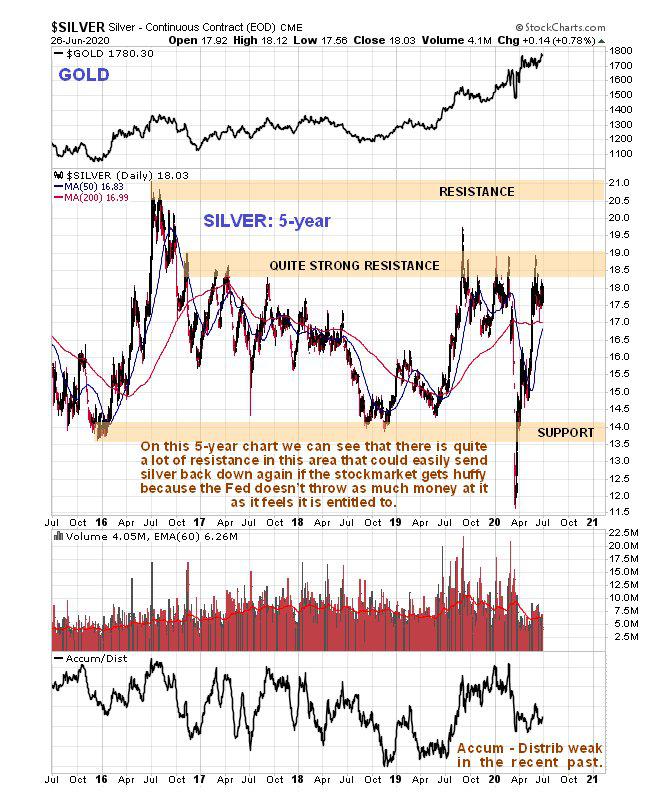
The 5-year chart reveals that silver is battling a lot of resistance in this zone, so if gold should back off soon for whatever reason, like the stockmarket dropping hard, then it will likely drop back for a while too. Here we should note that if the stockmarket does go into another downwave soon then the Fed can be expected to print up another couple of trillion to drive it back up again, which will be hyperinflationary and very bullish for gold and silver. Keep in mind that if the Fed (or its proxies) wade in here buying stocks they can head off any decline and get it moving higher again.
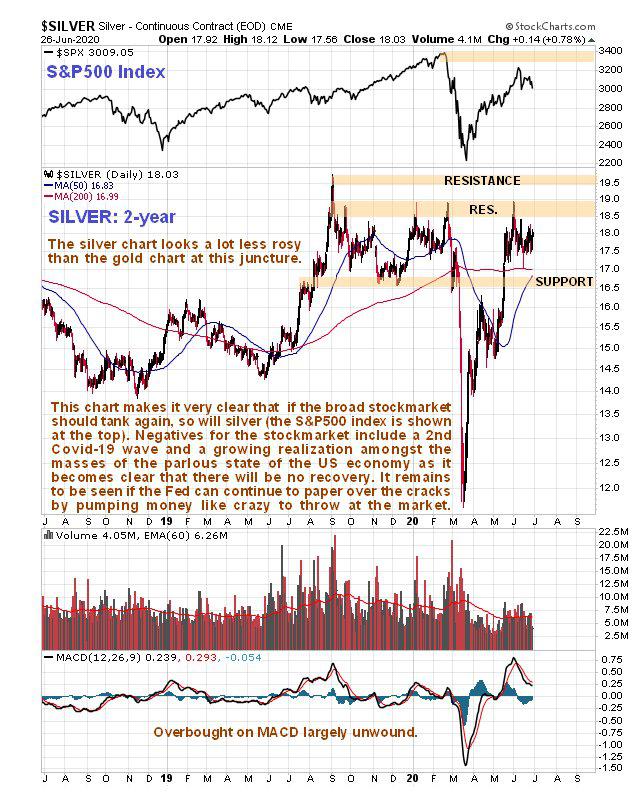
The 2-year chart for silver with the S&P500 index shown at the top is useful as it makes clear that there is a crude but important correlation between silver and the stockmarket, which can be expressed bluntly as “when the stockmarket tanks it takes silver with it”. The message from this chart is thus clear – if the stockmarket continues to advance courtesy of continued Fed pumping, then there is a good chance that silver will break out of its base pattern, but if the Fed “falls down on the job” and the stockmarket tanks again, so will silver. Big Money doesn’t care about either the economy or the unemployed – all it cares about is the stockmarket and how much it can make out of deals etc. On this chart we see that although silver’s overbought condition has neutralized in recent weeks putting it theoretically in position to break out of its giant base, there is a lot of resistance above the current price that we can expect to turn it down if the stockmarket weakens.
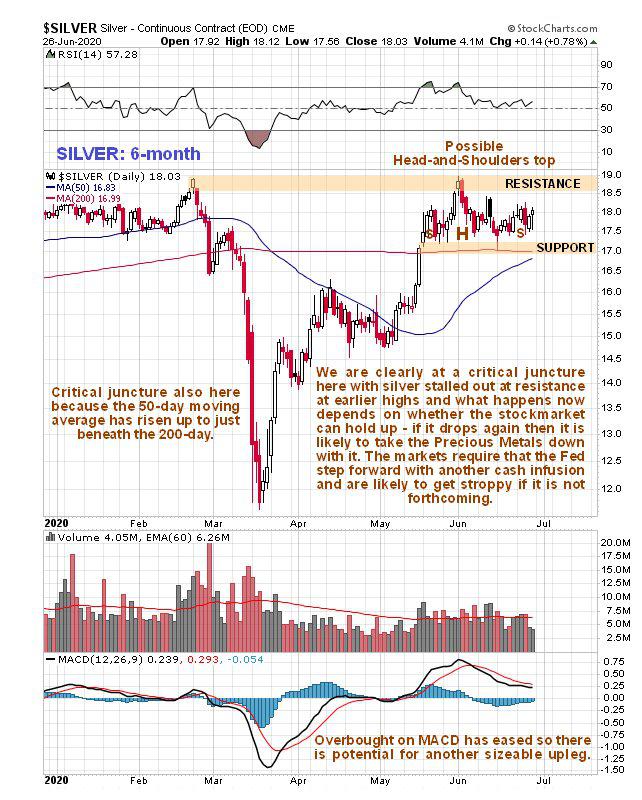
Finally on the 6-month chart we can see that silver is at a critical juncture here, with the 50-day moving average pulling up close to the price and the 200-day, with a small potential Head-and-Shoulders top completing, so we can expect a bigger move soon.
*********
More from Silver Phoenix 500


