Silver Market Update - STILL HUGE UPSIDE FROM HERE...


Given what has been going on the advance in silver since the last update early in january has been modest, and it is only in the past few weeks since the Russian invasion of Ukraine began that it has really started to get moving.
On its latest 13-year chart we can see that, despite the gains of recent weeks, silver remains stuck in the trading range that started to form in August of 2020, so it has been in this range for about 18 months now.
Investors or would be investors in the silver space should not be discouraged by this performance, however, because commodities as a whole are really taking off now due to the twin drivers of inflation and shortages created by war, embargoes and sanctions etc. And silver is regarded as probably the most undervalued commodity around, especially in relation to its future potential. Its recent underperformance relative to gold is normal at this early stage of a nascent PM sector major bullmarket, with the silver to gold ratio that we will look at towards the end of this update being still at the sort of low level which shows that there is no speculative froth in the sector at all, and thus there is everything to go for with silver and silver investments.
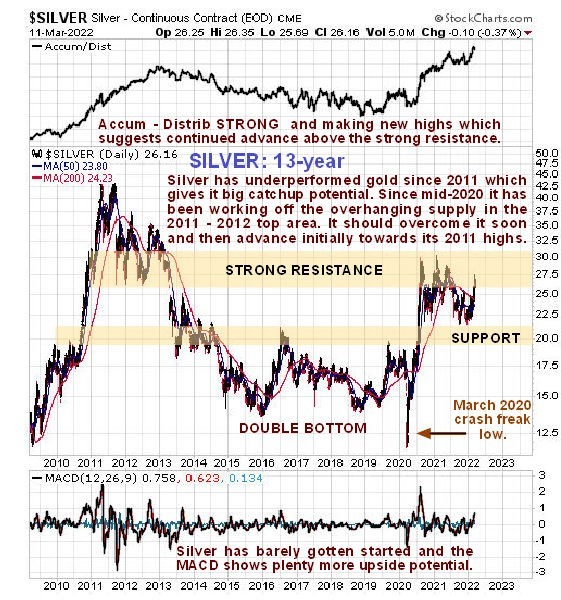
On the 13-year chart we can see why silver has been rangebound for the past 18 months – one the one hand it has been consolidating its earlier breakout from a giant Double Bottom base pattern and on the other it has been working off the considerable overhead resistance arising from the 2011 – 2012 top area. Once it has absorbed this supply – and it is suspected of having almost achieved this – it will then push on to challenge its 2011 highs which it should overcome in due course as the sector bullmarket continues and accelerates due to the demise of fiat. The strong Accumulation line which is making new highs promises an upside breakout from the trading range soon and the modest MACD reading shows that there is plenty of immediate upside potential from here.
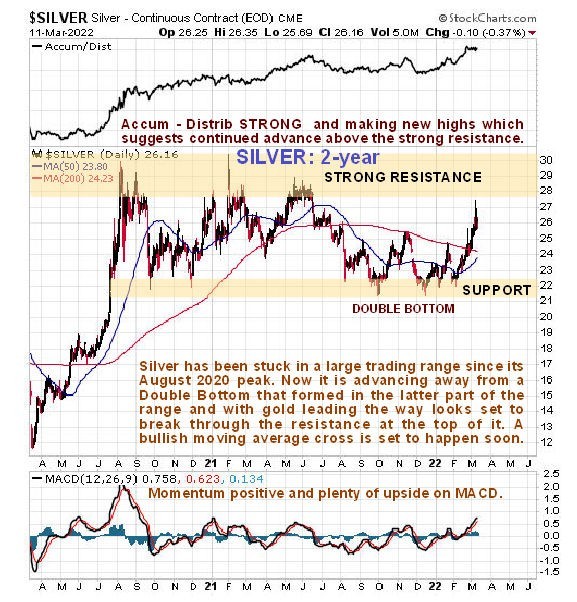
On the 2-year chart we can see the trading range that formed from the August 2020 top in much more detail. Points to note on this chart include that the current advance was out of a smaller Double Bottom base pattern that formed from last September – October through December and that we will soon see a bullish cross of the movinbg averages. Due to the current short-term overbought condition and the fact that it is approaching resistance we should not be surprised to see some sharp down days, such as has occurred this morning due to a glimmer of hope related to talks over Ukraine, but these talks will probably accomplish nothing.
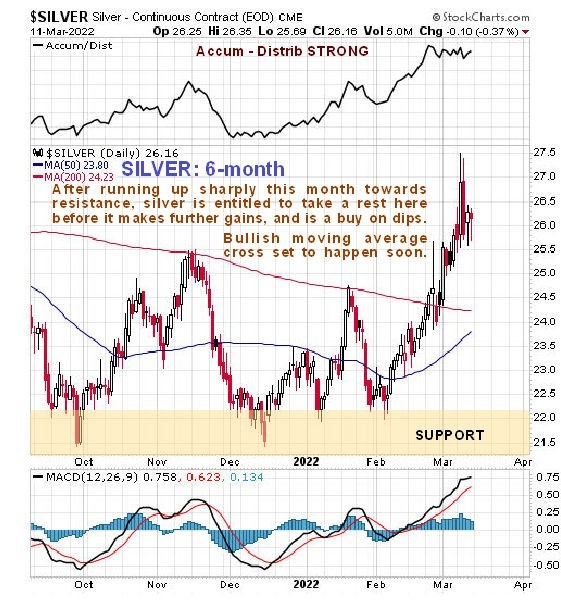
On the 6-month chart we can see that silver only really got moving once Russia invaded Ukraine. It looks a little toppy short-term but on the plus side we can see again the strong Accumulation line and the soon to occur cross of the moving averages, which together suggest, as does the picture we have seen in gold, that silver is a strong buy on any dips.
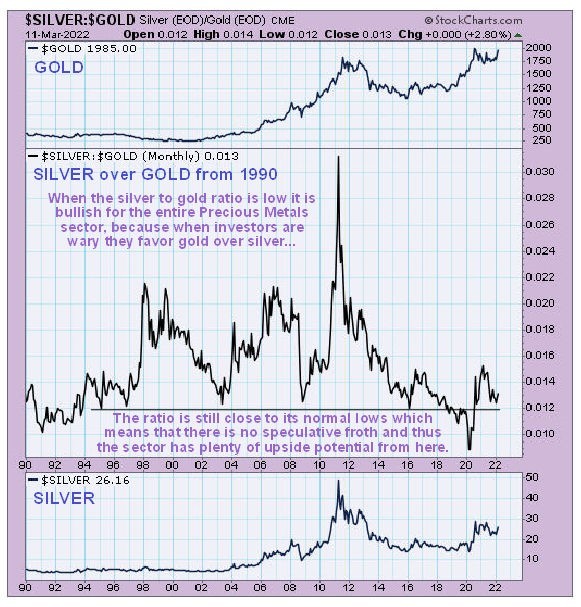
Lastly we will take a look at the long-term chart for the silver to gold ratio. The reason that tis is a guide is that when investors are cautious towards the PM sector thry tend to favor gold over silver, which they regard as more speculative, and viceversa when they are strongly and very possibly excessively bullish on the sector. So we see that the ratio was at a low point at the 2008 crash low, at a very high point when the sector peaked in 2011 and at an extreme low early in 2020 right before a big sector rally. While it is now some way above the 2020 low we can see that it is still close to its normal lows, shown by the horizontal line, which means that there is still plenty of upside potential for the sector from here and also shows that there is currently no speculative froth at all, such as we saw at the 2011 highs. So the PM sector looks like a solid and relatively very safe place to invest money here, and silver especially as it is undervalued relative to gold.
******
More from Silver Phoenix 500


