Silver Miners’ Q3’20 Fundamentals


The silver miners’ stocks have been grinding lower on balance since early August in a healthy correction. This necessary rebalancing is achieving its mission of dampening enthusiasm, paving the way for this sector’s next bull upleg. Rebounding from governments’ COVID-19 lockdowns, operating and financial results improved dramatically in the recently-reported Q3. Better fundamentals justify more stock-price gains.
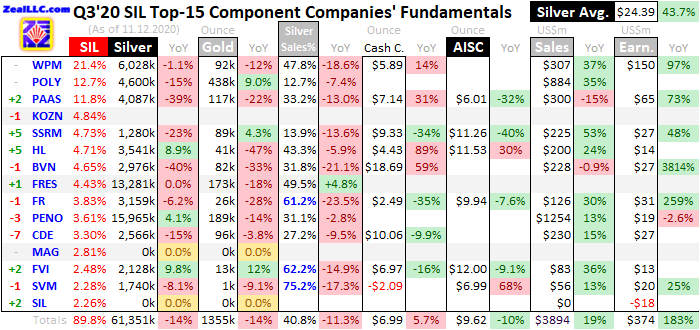
There aren’t many major silver miners in the world, and only a handful are primary silver producers that derive over half their revenues from silver. With such a small population, there are only a few silver-stock ETFs. The leading and dominant one is the SIL Global X Silver Miners ETF, which is this tiny sector’s best benchmark. But it only held $1.0b in net assets in mid-November at the end of Q3’20’s earnings season.
SIL’s super-volatile price action this year reflects the wild ride silver stocks have had. Over 4.8 months into early August, this ETF skyrocketed 176.9% higher out of mid-March’s stock panic! That left silver stocks extremely overbought, thus due for a correction to rebalance sentiment. And that is exactly what has happened since, with SIL’s total selloff extending to 23.5% at worst over 3.6 months so far by late November.
The silver miners’ stock prices naturally mirror and amplify the underlying moves in the metal they mine, which overwhelmingly drives their profitability. And silver in turn leverages gold’s fortunes, which is the white metal’s dominant primary driver. So silver’s ongoing correction won’t give up its ghost until gold’s does, and silver stocks’ next bull-market upleg is waiting on silver’s own. Silver miners are at the mercy of gold.
This yellow metal’s rebalancing selloff has matured, after making great strides in rebalancing sentiment since gold shot parabolic last summer. American stock traders’ heavy gold-ETF-share buying that fueled that powerful upleg has rolled over into serious selling in November. And the positioning of gold-futures speculators has been excessively-bullish, leaving a risky selling overhang for the oversold US dollar to trigger.
But even if these gold-driven silver and silver-stock corrections haven’t fully run their courses yet, traders need to stay abreast of the silver miners’ fundamentals. The stronger they are, the greater this sector’s upside potential in its next bull-market upleg. The silver miners’ recently-reported Q3’20 results showed huge fundamental improvements from the prior quarter, which suffered widespread national lockdowns.
This was my 18th quarter in a row analyzing how the world’s biggest and best silver miners are faring fundamentally. While SIL included 40 component stocks in mid-November as Q3’s earnings season was wrapping up, I limited my research to its top 15 holdings. They commanded a dominant 89.8% of SIL’s total weighting. These silver giants mostly trade on stock exchanges in the US, UK, Canada, and Mexico.
That makes amassing their quarterly data somewhat challenging, with reporting varying considerably in different countries and companies. Half-year reporting is common outside the US, and Q3s are off-cycle quarters seeing shorter updates. The highlights of all those reports are included in this table. Stock symbols are listings from companies’ primary exchanges, with the majority of the SIL top 15’s outside the US.
That’s preceded by their ranking changes in terms of SIL weightings between Q3’19 to Q3’20. And it is followed by these major silver miners’ current SIL weightings as the Q3 earnings season concluded in mid-November. Then each company’s quarterly silver and gold production in ounces is shown, followed by their year-over-year changes from Q3’19. Their silver output can be used to gauge relative silver purity.
The higher miners’ percentage of quarterly revenues derived from silver production, the more responsive their stock prices are to silver price action. The next column shows this metric of silver-centricness. It is mostly calculated by multiplying companies’ quarterly silver outputs by silver’s average price in Q3, then dividing those results by quarterly revenues. When sales aren’t reported, this can instead be approximated.
For half-year-reporting silver miners where Q3 was an interim quarter, those implied silver revenues can be divided by implied gold-plus-silver sales. But that method is inferior since it excludes base-metals byproducts. According to the Silver Institute, only 29% of all the silver mined worldwide in 2019 came from primary silver mines. 32% was a byproduct from mining lead and zinc, with another 23% from copper.
The rare primary silver miners’ silver-purity percentages are highlighted in blue. Their stock prices usually show the highest leverage to silver. That is followed by cash costs and all-in sustaining costs per ounce, along with their year-over-year changes. They reveal how much it costs the SIL-top-15 silver miners to blast their metal loose from the earth and process it. Finally comes quarterly revenues and hard GAAP profits.
Blank data fields mean a company hadn’t reported that particular data by mid-November as Q3’s earnings season was ending. And percentage changes aren’t included if they would be either misleading or not meaningful. The main examples are comparing two negative numbers and when data shifts from positive to negative or vice versa over this past year. These elite silver miners showed major improvements last quarter.
Production is the lifeblood of the silver-mining industry, and the SIL top 15’s collective output in Q3 was mixed. Together these major silver miners produced 61.4m ounces last quarter. Sequentially from the lockdown-plagued Q2’20, that was outstanding 13.7% quarter-on-quarter growth. When governments authorized shut-down silver mines to resume operations again, these companies were quick to spin back up.
Nevertheless, the national lockdowns’ serious impacts on global silver output lingered in Q3. That 61.4m ounces the SIL top 15 produced were still down a sharp 13.9% year-over-year from Q3’19! Outside of the preceding peak-lockdown quarter’s 26.0% YoY plummeting, that was the worst seen in all the years I’ve been working on this research thread. But that output was skewed low by the endless shuffling in SIL’s ranks.
A year ago in Q3’19, a British gold-and-silver miner called Hochschild Mining was this ETF’s 14th-biggest component stock. SIL essentially weights its holdings by silver stocks’ market capitalizations. But in mid-November, this company had slipped to 16th place. Replacing it was the non-producing Canadian silver explorer SilverCrest Metals. That pushed Hochschild’s 3,085k ounces produced in Q3’20 out of the SIL top 15.
Adding that back in yields total major-silver-miner output of 64.4m ounces last quarter, which is down a still-big-but-less-extreme 9.5% YoY. The elite silver miners are heavily concentrated in countries that suffered the longest lockdowns, which spilled into Q3. Those are Mexico and Peru, which accounted for 23% and 16% of 2019’s total global silver output per silver’s leading fundamental authority the Silver Institute.
The SIL-top-15 silver miners also continued to contend with COVID-19 beyond the lingering lockdowns. That includes implementing costly and disruptive measures to slow this virus’s spread, identify workers infected, and quarantine them. This led to widespread labor shortages, forcing many silver mines to operate with reduced staffing which is less efficient. Major silver miners’ quarterlies detailed some of the challenges...
“During Q3 2020, seven of Pan American’s nine operations were operating with limited workforce levels in order to accommodate COVID-19 related protocols. Two of the Company’s operations, Huaron and Morococha in Peru, were suspended for most of Q3 2020, having previously been returned to care and maintenance on July 20, 2020, because of an increase in workers testing positive for COVID-19.”
Pan American Silver’s Q3 report continued “The Company began gradually redeploying its workforce at these mines over the last two weeks of September after intensive health screenings and testing. Huaron and Morococha resumed operations at the end of Q3 2020.” In Q1’20 before the pandemic lockdowns, these two mines accounted for 22% of PAAS’s silver output. Mines being stuck offline really slams production.
First Majestic Silver, which SIL holds under its Canadian stock listing, had ongoing COVID-19 struggles last quarter too. “Worker availability is a challenge amidst the COVID-19 pandemic but has been gradually improving and is being mitigated by increasing the use of temporary workers and contractors to replace vulnerable workers.” That company said those employees accounted for 1/9th of its mine workforce.
Mexico’s Ministry of Health defines these as people at least 60 years old, or suffering from either pre-existing health conditions or compromised immune systems. First Majestic believes COVID-19 infections are such an ongoing threat to operations that it is “also in the process of constructing Polymerase Chain Reaction (“PCR”) laboratory test facilities on site at San Dimas and partnering with test labs at Santa Elena”!
So it is certainly not business as usual for the major silver miners, which are again concentrated in Mexico and Peru since they host the biggest silver deposits. In mid-November as Q3’s earnings season wrapped up, these two countries ranked 11th and 12th in the world in terms of cumulative cases of COVID-19 since testing started. In terms of COVID-19-attributed deaths they fared even worse, at 4th and 10th globally!
These major silver miners’ gold operations, some standalone mines and some byproducts from silver mines, are also largely located in these same countries. So it isn’t surprising that the SIL top 15’s total gold output in Q3’20 mirrored silver’s. The 1,355k ounces these miners produced surged 12.3% QoQ from Q2’20’s lockdown nadir, in line with silver’s 13.7%. But it fell 14.4% YoY from Q3’19, pacing silver’s 13.9%.
Again Hochschild Mining being edged out of the SIL top 15 played a role in this, as it produced 47.8k ounces of gold last quarter. Including it, the major silver miners’ overall gold output drop moderated a bit to 11.4% YoY. The silver miners’ operational struggles in Q3’20 were much worse than the major gold miners of their leading GDX ETF. The GDX top 25 actually saw their overall gold output grow 0.6% YoY in Q3!
Despite the major silver miners’ aggregate silver and gold production falling proportionally last quarter, their overall silver purity plunged considerably. The SIL top 15 averaged just 40.8% of their Q3 revenues from silver, down 11.3% from Q3’19’s 52.1%. That comparable quarter was a high-water mark though, the highest seen in the 18 quarters I’ve been doing this research. That entire span only averaged 38.8%.
Last quarter a relatively-high three silver miners out of the SIL top 15 qualified as primary ones deriving over half their sales from the white metal. They were First Majestic Silver at 61.2%, Fortuna Silver Mines at 62.2%, and Silvercorp Metals at 75.2%. These remain the most-leveraged stocks to silver uplegs, with the best potential to amplify their gains. Fundamentally-superior stocks far outperform deadweight-laden ETFs!
Remember that SIL soared 176.9% in its last mighty upleg between mid-March to early August. In this same short span, First Majestic, Fortuna, and Silvercorp saw their stock prices skyrocket 176.2%, 291.7%, and 278.8% higher! That averages out to 248.9% upleg gains, 1.4x better than SIL’s which these stocks also helped boost. These purest silver stocks far outperformed the other 12 major silver miners in the SIL top 15.
With the SIL top 15’s COVID-19-vexed silver output staying much lower than Q3’19’s levels, unit mining costs should’ve climbed. In silver mining, output and costs are inversely proportional. The more silver mined, the more ounces to spread this industry’s big fixed costs across. Those generally don’t change much from quarter to quarter, regardless of prevailing silver prices. That gives silver mining big leverage to silver.
Individual mines require the same levels of infrastructure, equipment, and employees to feed their fixed-capacity mills quarter after quarter. So lower outputs directly translate into higher unit costs. In Q3’19 in the idyllic pre-pandemic world, the SIL top 15’s cash costs and all-in sustaining costs had been running $6.61 and $10.74 per ounce. In Q3’20 those should’ve risen in proportion to the 13.9% shrinkage in silver output.
Cash costs are the classic measure of silver-mining costs, including all cash expenses necessary to mine each ounce of silver. But they are misleading as a true cost measure, excluding the big capital needed to explore for silver deposits and build mines. So cash costs are best viewed as survivability acid-test levels for the major silver miners. They illuminate the minimum silver prices necessary to keep the mines running.
The SIL top 15’s reported cash costs averaged $6.99 per ounce last quarter, indeed rising but only by 5.7% YoY. And those were actually skewed high by Peru’s Buenaventura, which suffered COVID-19-related disruptions to many of its operations. Its resulting brutal 40.4% YoY silver-output plunge caused cash costs to skyrocket 58.9% YoY to $18.69! Excluding that crazy-extreme outlier, the average drops to $5.53.
The negative cash costs reported by Silvercorp are righteous, resulting from huge byproduct credits from its major lead and zinc production. Those aren’t an anomaly, this company has reported negative cash costs for years. Its market capitalization usually leaves it around the cutoff for the SIL top 15 after any given earnings season. So whether or not SVM is included really affects the major silver miners’ overall average.
All-in sustaining costs are far superior than cash costs, and were introduced by the World Gold Council in June 2013. They add on to cash costs everything else that is necessary to maintain and replenish silver-mining operations at current output tempos. AISCs give a much-better understanding of what it really costs to run silver mines as ongoing concerns, and reveal the major silver miners’ true operating profitability.
Amazingly given their falling silver output, the SIL top 15 reported a big surprise last quarter on that front. Their average AISCs of just $9.62 per ounce not only shockingly fell 10.4% YoY, but were the lowest seen out of the last 18 quarters! The major silver miners did fantastic controlling costs, despite all the additional COVID-19-related expenses they are facing. Plunging AISCs at two companies were mostly responsible.
Pan American Silver saw its AISCs collapse 31.7% YoY, while SSR Mining’s dropped an even-greater 39.7%! These sharply-lower costs moved hugely counter to these miners’ serious 38.7% and 23.1% craterings in silver outputs last quarter. Buried deep in PAAS’s report, its sharp AISC plunge was attributed to inventory adjustments. Unfortunately that was a one-off anomaly related to COVID-19 production swings.
Pan American’s full-year-2020 guidance is forecasting AISCs at a midpoint or $11.50, almost double that super-low Q3 read! SSRM explained its own lower AISCs paradoxically arose from reduced costs due to lockdowns, not elaborating much. But it too warned that these low AISCs won’t last, guiding to this year’s averaging a much-higher $16.00. So overall SIL-top-15 AISCs are likely to climb back up near $12 or so.
But regardless of prevailing AISCs, far-higher silver prices radically improved the profitability of this small sector. Q3’20’s average silver price of $24.39 rocketed up 43.7% YoY, way outpacing gold’s own 29.8% gain! That was the highest quarter for silver since Q1’13, after which silver collapsed with gold on the Fed’s extreme QE3 levitating the stock markets. Silver languished for long years after that brutal thrashing.
Looking at the major silver miners’ average AISCs compared to average prevailing silver prices is a great proxy for industry profitability. And with impressively-high silver prices and super-low AISCs last quarter, unit earnings naturally exploded. The SIL top 15 enjoyed enormous profits of $14.77 per ounce, which soared a stupendous 137.2% YoY! Both metrics proved the best by far in the 18 quarters I’ve been doing this.
Over the previous 17 quarters before Q3’20, silver-mining profitability per this proxy averaged just $4.46. And the silver miners are almost certain to continue generating huge earnings in this currently underway Q4’20. By mid-November as Q3’s earnings season wrapped up, silver was still averaging $24.26 quarter-to-date. That’s right in line with Q3’s $24.39! And even if silver keeps correcting, prices should remain high.
While gold governs the extent of silver corrections, silver’s 200-day moving average is strong support for major bottomings. Mid-month that was running $20.17 and rising. If silver challenges that at some point before Q4 ends, it would still be hard to imagine this quarter’s average silver price falling under $22 or so. And if SIL-top-15 AISCs climb back up near $12, that implies major silver miners still earning $10 per ounce.
If these mid-quarter estimates are in the ballpark, these elite silver miners’ unit earnings would soar yet another 63.7% YoY in this current quarter! Unless silver craters which is incredibly unlikely, we shouldn’t see any scenarios where silver-mining earnings don’t remain really strong. The higher this sector’s profits and the more sustainable they are, the greater silver stocks’ upside potential during silver’s next upleg.
On the hard-financial-results front under Generally Accepted Accounting Principles reported to securities regulators, or their foreign equivalents, the major silver miners achieved a great quarter financially in Q3’20. The SIL top 15’s total revenues surged 18.6% YoY to $3.9b! The much-higher prevailing silver and gold prices easily overcame the COVID-19-hobbled lower production of these two precious metals.
In actual bottom-line accounting-earnings terms, these major silver miners collectively reported earning a very-strong $374m in profits! That skyrocketed 182.9% YoY from Q3’19’s total, confirming that silver mining is very lucrative at these relatively-high price levels. Both quarters’ earnings numbers came from normal ordinary operating results too, with no big non-cash charges or gains distorting these sector totals.
Naturally the high silver prices also fueled massive operating-cash-flow-generation growth. Q3’20’s total OCFs reported by the SIL-top-15 silver miners soared 82.0% YoY to almost $1.5b! That helped these companies grow their treasuries by 35.7% YoY to $3.4b. They will likely deploy a large fraction of this big windfall to help expand existing mines, upping their future production. That’s really bullish for silver-stock prices.
With the major silver stocks sporting such strong fundamentals in Q3 and almost certainly again in Q4, their next bull-market upleg has strong potential to balloon to more outsized gains. But first this sector has to weather this necessary and healthy in-progress correction, which is controlled by gold’s own. This is the time to do your silver-stock homework, crafting a buy list for the bargains to come as this selloff climaxes.
The bottom line is the major silver miners reported strong Q3 results. Their collective gold and silver outputs rebounded sharply from Q2’s lockdowns. But lingering COVID-19 impacts still left production considerably lower than the comparable prior-year quarter. Yet somehow the miners still managed to cut costs in that challenging environment, contributing to outstanding earnings in both unit and bottom-line terms.
The highest prevailing silver prices in the better part of a decade fueled big growth in profits, sales, and operating cash flows. And with silver remaining high despite being in a healthy correction, silver miners’ super-bullish trend of fast-improving fundamentals is likely to continue. That portends much-higher silver-stock prices as their metal’s next bull-market upleg gets underway. This silver-stock bull has lots of room to run.
At Zeal we started aggressively buying and recommending fundamentally-superior gold and silver miners in our weekly and monthly subscription newsletters back in mid-March right after the stock-panic lows. We layered into dozens of new positions before silver stocks grew too overbought, which were stopped out later at huge realized gains running as high as +199%! Our subscribers multiplied their wealth within months.
To profitably trade high-potential gold and silver stocks, you need to stay informed about what’s driving gold. Our popular newsletters are a great way, easy to read and affordable. They draw on my vast experience, knowledge, wisdom, and ongoing research to explain what’s going on in the markets, why, and how to trade them with specific stocks. Subscribe today and take advantage of our 20%-off sale! We’ll redeploy aggressively in fundamentally-superior gold and silver stocks as this correction passes.
Adam Hamilton, CPA
Copyright 2000 - 2020 Zeal LLC (www.ZealLLC.com)
*********
More from Silver Phoenix 500


