Silver Peak Likely Only After Dow Index Crash And Major Bottom


Last year I produced the following chart and commentary (italics) to show how the Dow could crash like it did in 1929:
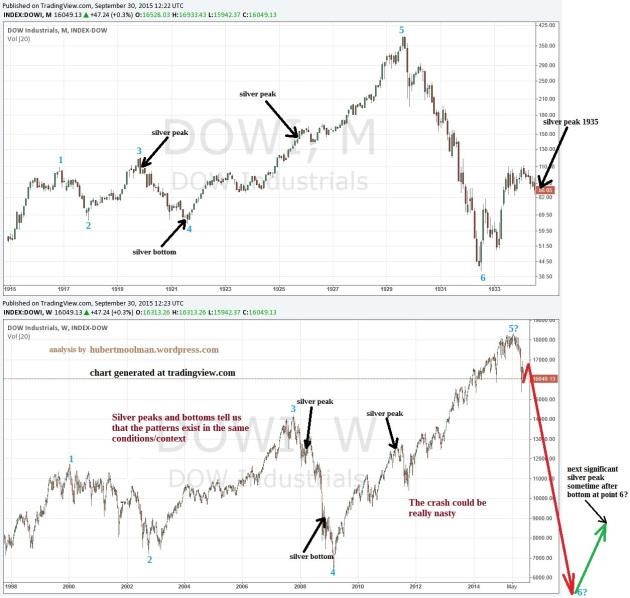
Above, is a fractal comparison between the current period (1998 to 2015) and the 1920/30s, for the Dow (charts from tradingview.com). Follow the two patterns marked 1 to 5. I have also indicated where silver peaks and bottoms occurred, to show that both patterns exist in similar conditions. This means that there is a strong likelihood that the crash will occur.
If the Dow peak is in (at point 5), then it could free fall soon, much like the October 1929 crash. This could be the greatest Dow crash ever. Therefore, the greatest silver rally could be on its way (why?).
Here, I would like to add a little more.
Notice how the Dow peaks at point 3 (in both charts) came relatively close to a silver peak. Furthermore, notice how the Dow bottoms at point 4 (in both charts) came relatively close to a silver bottom. This shows that silver, and the Dow have been roughly moving together during those relevant periods (in the 20s & 30s and the current pattern).
However, after the third silver peak shown (on both charts) there was a big divergence between silver and the Dow. For example, while silver peaked in 2011, it continued to rally until 2015. See chart of the current pattern to illustrate the moving together and the eventual divergence below:
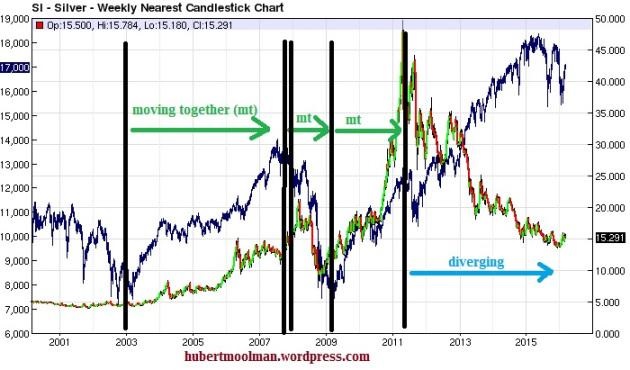
(Chart from barchart.com - note the Dow is the blue chart and silver is the green & red one)
********
For more of this kind of analysis, you are welcome to subscribe to my premium service. I have also recently completed a Long-term Silver Fractal Analysis Report .
More from Silver Phoenix 500


