Silver Pierced Its September Lows Despite The USD Staying Put


In the previous weeks we’ve been featuring multiple factors that are likely to usher in a sizable gold, silver and mining stocks’ moves. Has the very recent downswing been the opening act? The USD Index closed flat on Friday, yet the metals declined across the board. The gold to silver ratio presents us with a highly interesting perspective to say the least. Can you say a meaningful clue of upcoming price action?
Yes, it is one. In the previous weeks we’ve been featuring multiple factors that are likely to result in lower gold, silver, and mining stock values in the following months. The very recent downswing is likely only the beginning of what’s to come. There are even more signals pointing in this direction, though.
On Friday, we commented on the gold to silver ratio chart and in today’s analysis we would like to provide you with a quick update.
No, the implications didn’t change. We simply noticed something new about this chart and wanted to share it with you. Let’s start with a quote from Friday’s analysis.
Gold to Silver Ratio Chart Outlook
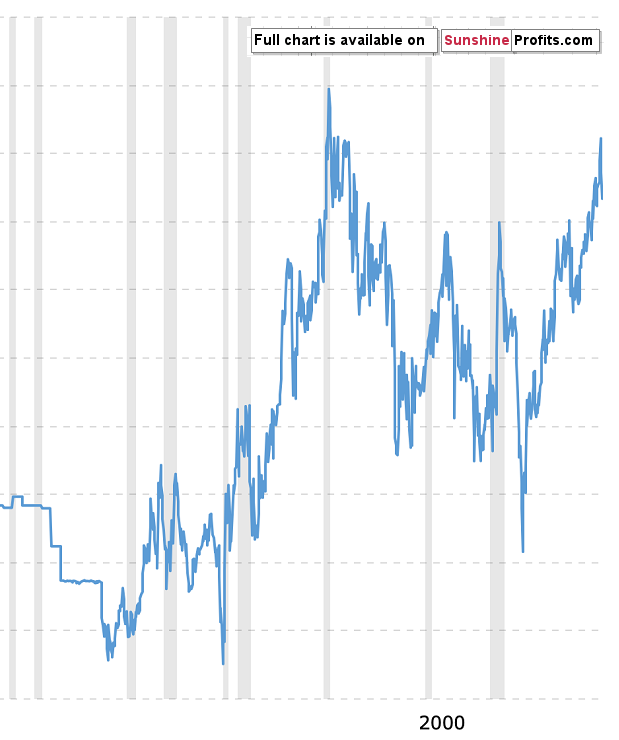
Over 2 years ago, when the gold to silver ratio was trading at about 78, and practically everyone was writing that the ratio moved to a resistance and was about to decline strongly, we wrote an article in which we argued that the 80 level and the most recent highs are not the ultimate long-term resistance and that the real resistance is the 100 level. In the following months, the ratio continued to climb and even soared above 90. It declined sharply after that, which begs the question whether this decline actually changes anything.
Absolutely not, tt doesn’t change anything. As we already wrote, no market can move up or down in a straight line and what we saw recently, was just a corrective downswing. It might have appeared to be an important short-term development, but it’s not correct to evaluate it in this way. It was a long-term breakout (above the previous highs at about 80) that we saw recently, so one should look at the decline from this point of view. And what does the above very long-term picture tell? That the recent decline is barely visible. The ratio is trading at about 85 at the moment of writing these words, which means that the breakout above the previous highs was just successfully verified.
The implications of the current situation in the gold to silver ratio are bullish for the ratio. And they are bearish for the entire precious metals sector as gold, silver, and mining stocks tend to move – on average, and in the long run – in the opposite way to the ratio’s direction.
Once the gold to silver ratio hits 100, it might be a good idea to back up the truck with gold, silver and quality mining stocks, but we’re far from this moment at this time.
The thing that we would like to add today is that both massive rallies that ended at about 100 were characterized by a specific development. Namely, there was a visible pullback from the 80 level. We saw the very same thing in 2016. At that time, the corresponding rally in silver seemed like a big rally – perhaps even a game-changer. Yet, the bullish silver forecasts didn’t play out as expected – silver is well below its 2016 high. It’s even quite visibly below this year’s high. The corresponding decline in the gold/silver ratio was a very normal development. What is more, this correction was smaller than the previous ones, suggesting that the uptrend is even stronger this time. The bullish implications for the ratio and the bearish implications for the precious metals sector clearly remain in place.
Precious Metals on Friday
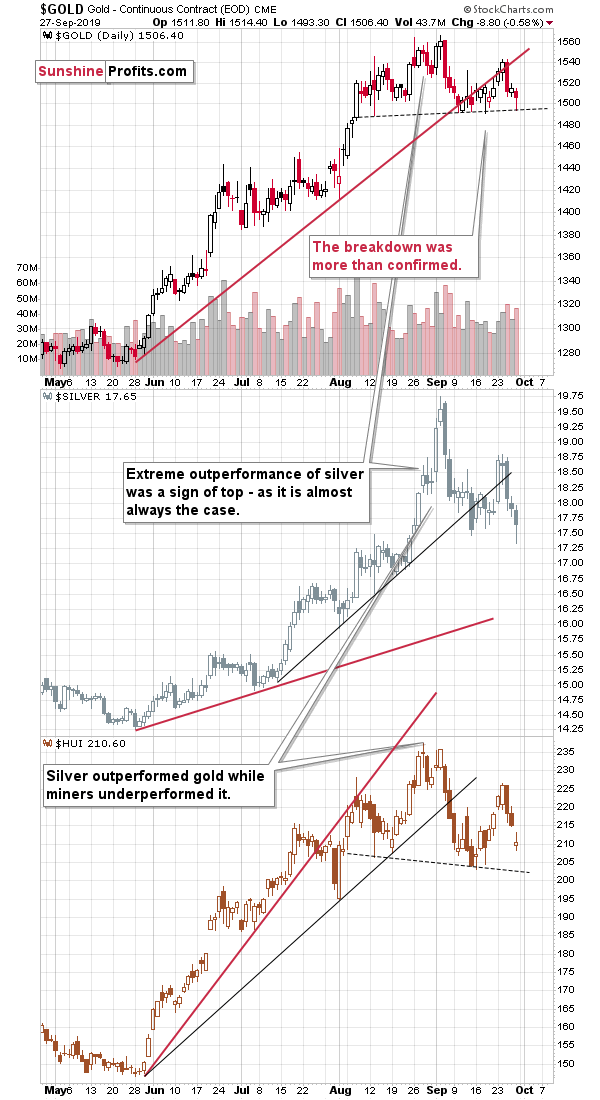
The entire trio: gold, silver, and mining stocks declined. Silver even temporarily moved to a new monthly low. The decline was normal and expected. What didn’t happen, though, was the breakdown below the neck levels of the head and shoulder patterns in case of gold and the HUI Index. This means that these formations were not yet completed, and we might still see some back and forth movement instead of the continuation of the decline. Completion of the formations will make the next short-term slide very likely.
Then again, let’s keep in mind that the above-mentioned decline in the precious metals market happened without USD Index’s help.
USD Index Went Nowhere on Friday
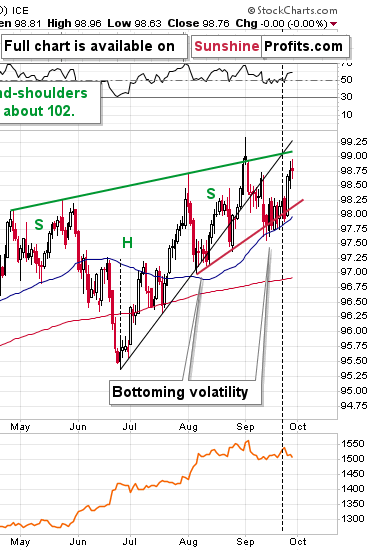
Despite the intraday movement, the USDX ended the session completely flat. Given the above, it would be normal for the PMs not to decline or rally. And they did decline, so they showed daily weakness, which generally does not bode well for their future performance. The head-and-shoulders formations may have not been completed last week, but the odds are that they will be still completed shortly.
Summary
Summing up, the big decline in the precious metals sector appears to be finally underway, and the temporary USD-reversal-caused rally in gold and silver is likely over. Let’s keep in mind that once the USDX takes off, it will likely serve as fuel to the fire-like decline in the PMs that’s already underway. The similarity to mid-90s continues to support much lower gold prices in the following months. All in all, it seems that what we see right now is the beginning of the final stage of the prolonged decline in the precious metals sector that started in 2011. On a short-term basis, it seems that we might get some temporary strength once gold moves to about $1,330 – perhaps within the next several weeks.
Today's article is a small sample of what our subscribers enjoy on a daily basis. For instance today, we’ve covered a gold tops analysis from the 80s. Take heed as investing is also about the time you could have to sit through before breaking even if you just buy-and-hold. Then, we go on to present the lessons from the miners. Check more of our free articles on our website, including this one – just drop by and have a look. We encourage you to sign up for our daily newsletter, too - it's free and if you don't like it, you can unsubscribe with just 2 clicks. You'll also get 7 days of free access to our premium daily Gold & Silver Trading Alerts to get a taste of all our care. On top, you’ll also get 7 days of instant email notifications the moment a new Signal is posted, bringing our Day Trading Signals at your fingertips. Sign up for the free newsletter today!
Przemyslaw Radomski, CFA
Editor-in-chief, Gold & Silver Fund Manager
Sunshine Profits - Effective Investments through Diligence and Care
* * * * *
All essays, research and information found above represent analyses and opinions of Przemyslaw Radomski, CFA and Sunshine Profits' associates only. As such, it may prove wrong and be a subject to change without notice. Opinions and analyses were based on data available to authors of respective essays at the time of writing. Although the information provided above is based on careful research and sources that are believed to be accurate, Przemyslaw Radomski, CFA and his associates do not guarantee the accuracy or thoroughness of the data or information reported. The opinions published above are neither an offer nor a recommendation to purchase or sell any securities. Mr. Radomski is not a Registered Securities Advisor. By reading Przemyslaw Radomski's, CFA reports you fully agree that he will not be held responsible or liable for any decisions you make regarding any information provided in these reports. Investing, trading and speculation in any financial markets may involve high risk of loss. Przemyslaw Radomski, CFA, Sunshine Profits' employees and affiliates as well as members of their families may have a short or long position in any securities, including those mentioned in any of the reports or essays, and may make additional purchases and/or sales of those securities without notice.
*********
 Przemyslaw Radomski, CFA, is the founder, owner and the main editor of SunshineProfits.com.


