Silver Price Forecast: $30+ Silver In 2021


Silver prices rose nearly 163% from its Coronavirus-panic lows of $11.30 to its peak on August 6 of $29.82. However, following that incredible rise, silver has since fallen dramatically: from its August 6 peak down to its September 23 low of $21.64 is a drop of nearly 28% in just six weeks. As this article is going to press, the precious metal is trading in the middle region of that range at $24.50.
What is ahead for silver? Is this sell-off over, or is there more downside to come?
Our analysis suggests that silver is within the midst of a wide and volatile consolidation that will resolve upward within the next several months. Keep reading to learn why we expect silver to move above $30 per ounce into 2021.
Silver Investors: Keep One Eye on Gold
As precious metals investors, we have a unique benefit in our analysis toolbox in that we can compare two historic monetary metals to each other: silver and gold. Yes, both metals have served as stores of value for the last 5,000 years. And while the focus of this article will be on the silver price forecast, we should use our knowledge of gold in order to increase our understanding of its wilder cousin.
The important point to understand about gold is that it is currently retesting its breakout above its former all-time high resistance zone, which dates back to 2011 – 2012. This resistance zone existed between $1,800 and $1,920 (black). Note that after gold broke out in early 2020 (red callout), it subsequently made a new higher peak than in 2011 ($2,074).
Gold is now coming back into the resistance zone to retest that zone.
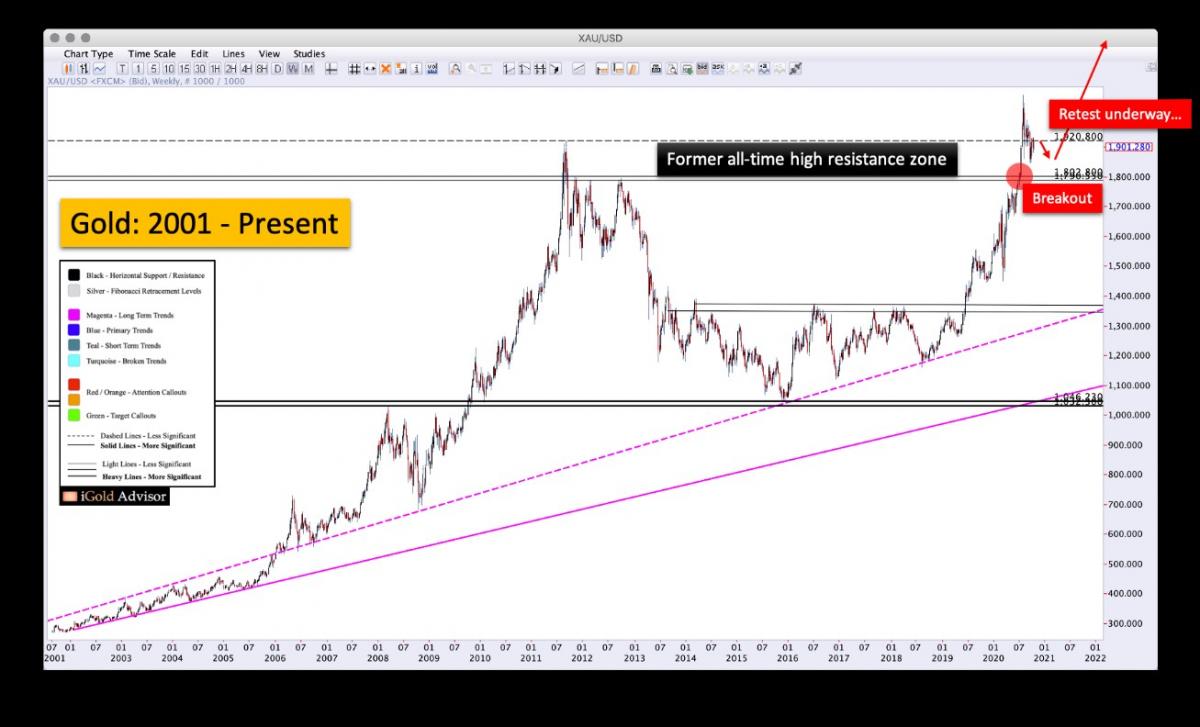
A retest is a process whereby sellers are daring buyers to show up again as they did during a breakout. The general rule in technical analysis is: “Breakouts should be respected until proven otherwise.” Thus, we should expect buyers to show up again now that the price is back into the former zone where the breakout first occurred.
This analysis suggests that downside is limited for gold here, as it should fall no further than the low $1,800’s on this correction.
Gold to Silver Ratio
If downside is limited for gold, does this give us any hint on what the future may hold for silver?
Below we show the gold to silver ratio from 2016 – present. This ratio measures the number of ounces of silver required to purchase one ounce of gold.
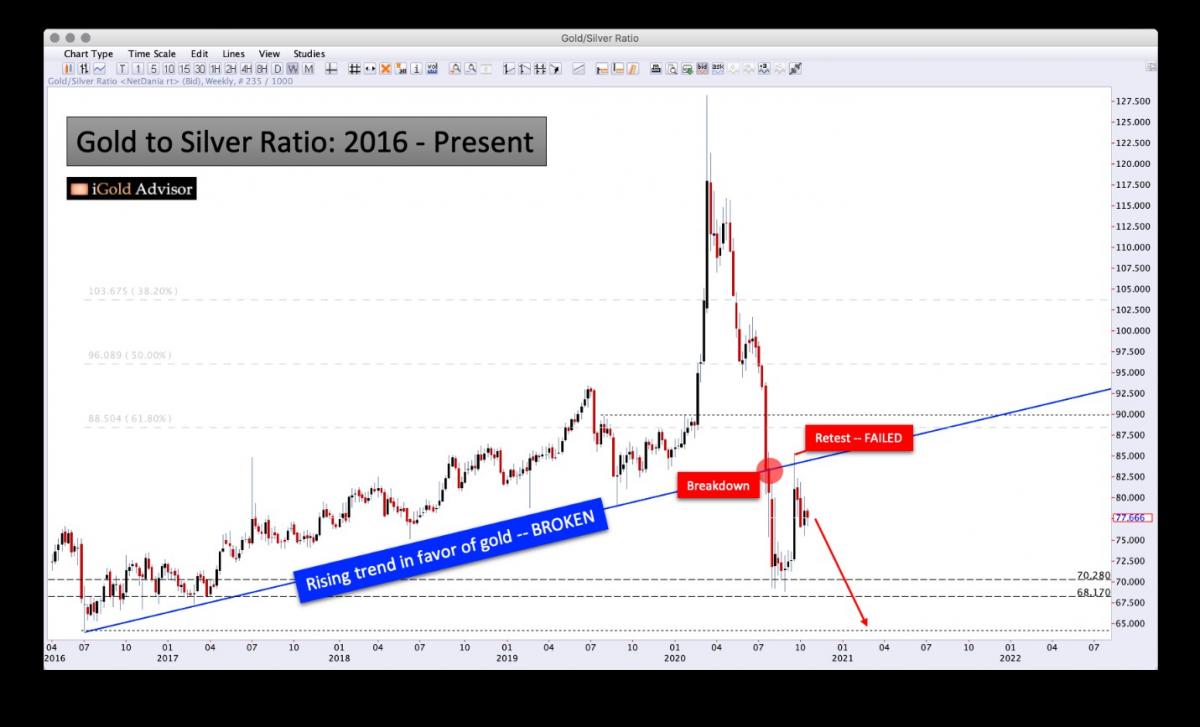
Note the rising trend which formed in July 2016 in favor of gold (blue). This trend showed us that gold was gaining value relative to silver throughout the 2016 – 2020 period.
The gold to silver ratio spiked higher during the Coronavirus panic in March 2020, reaching a new all-time high at 128 ounces of silver required to purchase one ounce of gold. The reason that the ratio spiked higher is that silver was being treated as an industrial commodity during the deflationary scare, and less as a precious metal.
However, something important happened in the aftermath of the Coronavirus selloff. As world governments moved to approve more and more stimulus measures, deflationary fears turned to expectations of future inflation, and the gold to silver ratio declined… not only back to where it was before the Coronavirus, but actually to below the entire 2016 – 2020 trend!
This trend break shows us that a new cycle in the market had begun.
Ratio Retest Fails
Note that following the trend break (red callout), the gold to silver ratio then came back to retest the former level (red callout). Again, we see textbook perfect price action here, as the broken trend lead to a retest, which then held, as expected. [Side note: this is the inverse direction of the retest which is now occurring in gold – yet the same principle applies no matter which direction a market is moving in.]
Following a successful retest, we should now expect a new trend to occur, only this time in the direction of the break, or downward in the case of the gold to silver ratio.
In other words, silver should now be expected to outperform gold over the years ahead.
If downside is limited in gold à and the gold to silver ratio has broken down in favor of silver à what does this tell us about silver price expectations?
Silver Price Analysis
Let us now dial in on the silver price itself. Below we show silver from the March Coronavirus lows through present:
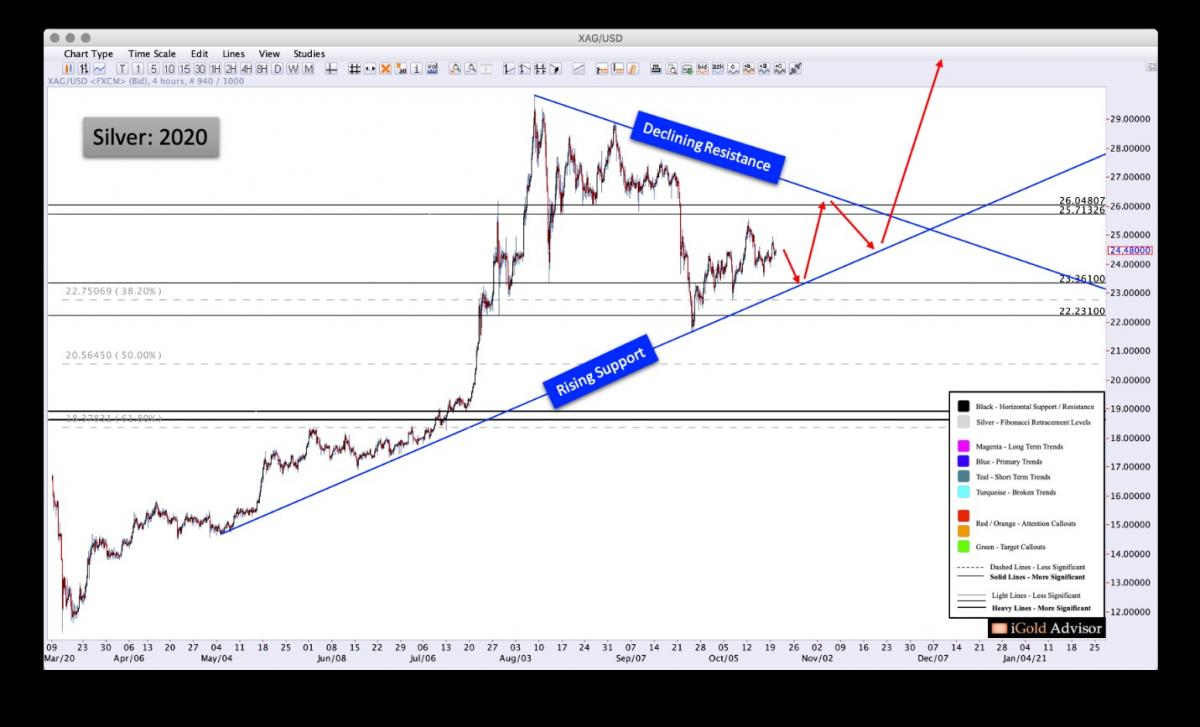
Although September’s sell-off was severe, silver has held above rising support, a zone which has attracted buyers since March (blue). For a myriad of reasons, buyers have been willing to pay higher and higher prices to get ahold of silver over the last six months.
The rule in technical analysis is: “Trends are valid until proven otherwise.” Presently, this rising trend of buyers comes in near the $23.00 mark; again, it is rising in time.
Further, a declining trend of sellers now exists since the August peak, presently at $27.00 and falling in time.
The rising trend of buyers and the declining trend of sellers will be meeting by early December, and so a resolution must occur by then.
Who will win out?
If gold is going to successfully retest its all-time high resistance zone à and the gold to silver ratio is set to trend lower for the next several years à then silver’s resolution will be upward, and we will see prices exceed the $29.82 peak by early 2021.
Election Turbulence?
What could cause this higher resolution for the silver price?
Our research suggests that a contested US election and/or civil unrest in the months following such an event may be the fundamental trigger which sets in motion higher precious metals prices. Of course, a new round of government stimulus will likely follow, which will result in an ever greater debt load and higher budget deficits for the country.
Investors should be preparing for such a possibility now. And indeed, the price action in the precious metals complex suggests that many are doing exactly that.
Takeaway on Silver Prices
Silver prices are within a volatile consolidation between $21.64 and just below $30.00; as wild as it may be, it is a consolidation nonetheless, and one which follows a significant advance from the March bottom.
Analysis of other components within the precious metals sector show that gold is now retesting its all-time high breakout zone, suggesting downside is limited.
The gold to silver ratio is still trending lower, in favor of silver.
Taken as a sum, these data points suggest that silver is due to emerge from this consolidation in an upward direction before the end of the year. At www.iGoldAdvisor.com we are now positioning private clients and research subscribers for this move ahead. Silver investors should be using any weakness in the silver price over the next 4 – 8 weeks to prepare for what should be a very exciting late-2020 and full year 2021.
********

Christopher Aaron began his career as an intelligence analyst for the CIA and Department of Defense. He served two tours to Afghanistan and Iraq between 2006 - 2009, conducting pattern-of-life mapping for military leaders.
Mapping shares similarities with technical analysis of the financial markets because both involve the interpretation of repeating patterns found in human nature. He is the founder of iGold Advisor, providing independent research and analytics on all aspects of the precious metals markets.
He speaks regularly on the cyclical patterns found within the financial markets and on international policy. He has been featured in the New York Times and NPR news amongst other financial publications.
More from Silver Phoenix 500


