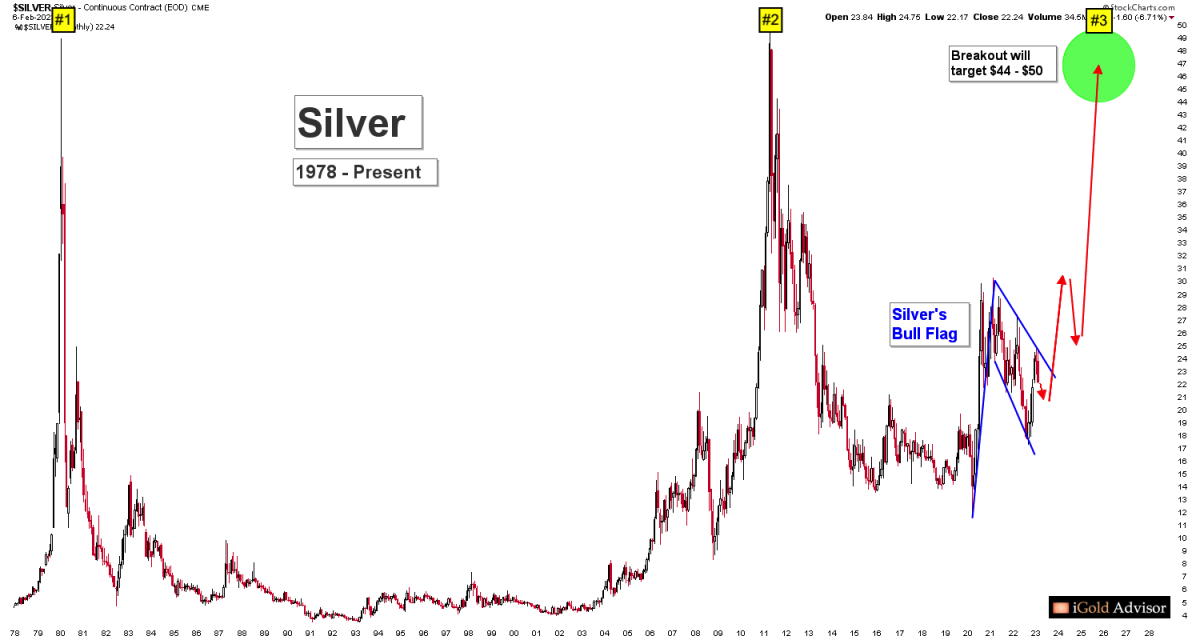
Silver Price Forecast: $44 - $50 Silver Following Breakout


 The silver price chart is as constructive as we could ask for in expectation of a rapid price appreciation starting in late-2023 and lasting through 2025. Upon a triggering of the current trading pattern, silver will target a price zone of $44 - $50 per ounce. Investors should use any price weakness over the coming months in either silver or high-quality silver miners to prepare for a rapid price appreciation starting later this year.
Silver’s Short-Term Bull Flag
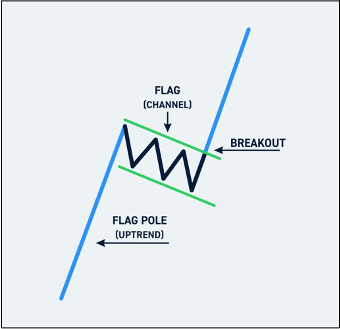
Silver’s short-term trading pattern is known as a bull flag, so named for its resemblance to a flag on a flagpole.
For reference, the pattern as shown in trading textbooks is shown below:
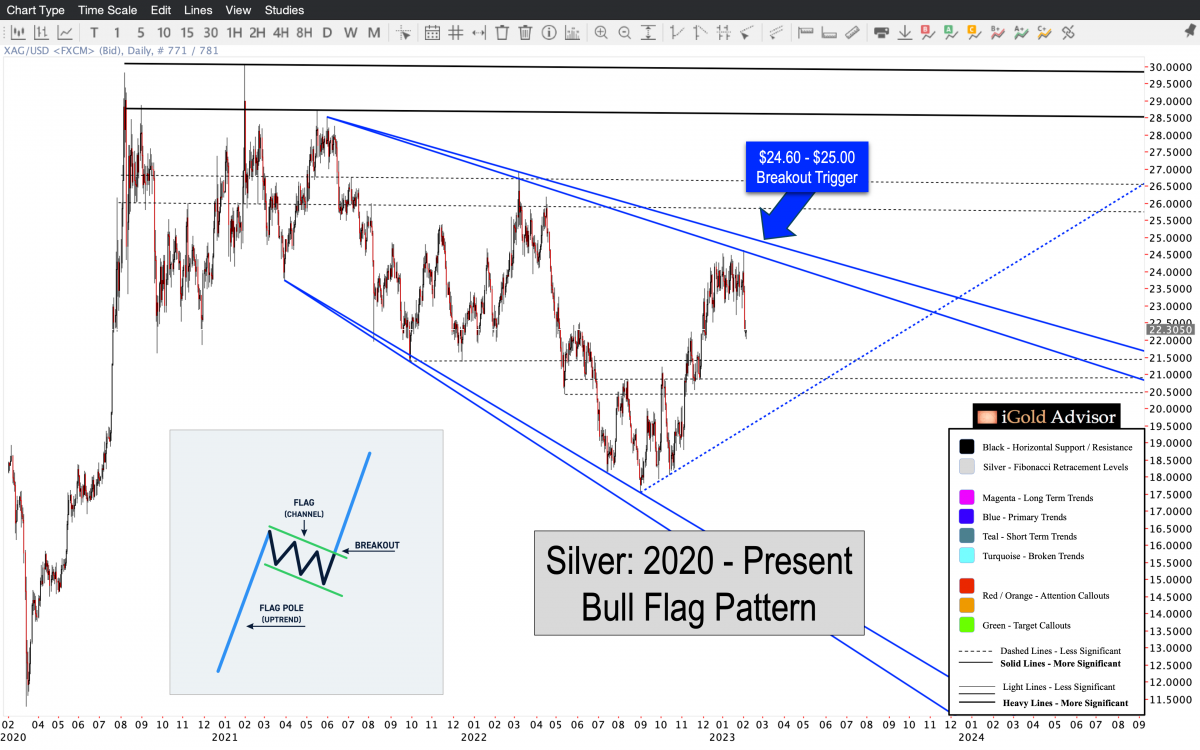
Next, we view the silver chart from 2020 through present:
-
Bull flag patterns are bullish continuation patterns. The “flag” or downward-sloping consolidation forms as a counter-trend to the prior impulsive movement.
-
In the case of silver, the original impulsive move was higher as silver advanced from $11 to $30 between March and August of 2020, following the worldwide panic during the onset of the Coronavirus pandemic.
-
Since early-2021, silver has been in the downward-sloping pause or “flag” portion of the bull flag pattern. During this time, we have witnessed overlapping waves of buying and selling, yet as a net sum silver has declined by $7.70 or 25.3% from the 2021 peak.
-
Trading now in early February at $22.30 per ounce, silver is the same price that it was 2.5 years ago. However, sentiment in the silver sector is substantially lower than it was when silver first hit $22.30 during the summer of 2020. At the time, silver investors felt euphoria and jubilation as prices rose; today, impatience and despair have taken over in the precious metals sector. This, despite the price being exactly the same.
-
The deterioration in silver sentiment amidst an overall sideways price movement is a necessary prerequisite to silver’s next impulsive advance. Markets like to take the least number of participants possible with them on waves higher, and by a process of repeating overlapping price waves over the last 2.5 years, silver has convinced many former bullish investors to abandon the sector. Many have thus sold in frustration.
-
It is precisely because so many have already sold amidst overall sideways price action, that few sellers remain in the silver sector. Silver has been transferred from weak hands to strong hands. And thus, when the next fundamental trigger appears, there will be few sellers left to contrast the wave of buying that will emerge.
-
Such sets the stage for the next impulsive advance: according to the textbook example, the continuation following the breakout from the “flag”.
Silver’s Target Will Be $44
Fortunately for technical-based investors, we have a fairly reliable way of projecting a price target for the pending breakout of the bull flag pattern in silver: we may add the amplitude of the initial advance (the flagpole of the pattern) onto the breakout point to derive a target.
In technical analysis it is often stated that: “flags stand at half-mast.”
What this means is that the flag or downward-sloping consolidation tends to form at the mid-point of the entire pattern. This is why the flag represents a pause during a larger bullish movement.
In the case of silver, we have a $19 amplitude on the original advance or flagpole. As we can see on the chart above, the resistance point of the flag comes in at $25. Adding the original $19 impulse onto the $25 breakout trigger yields a long-term target of $44 for silver, once the pattern is broken to the upside.
Silver’s Long-Term Perspective
Silver’s long-term perspective is thus expected to unfold as follows:
-
Note that silver’s eventual $44 target will take it to within just $6 of the formidable resistance zone at $50, the all-time highs set both in 1980 and in 2011. Since the independently-derived target is so close to such a clear long-term resistance zone, we can expect there to be a psychological “pull” toward the $50 level as silver is advancing toward its target. We can thus expand the target to a zone of $44 - $50 per ounce.
-
Silver’s eventual approach of the $44 - $50 level will represent the third major challenge at this multi-decade resistance zone since 1980.
-
On the question of “What will happen to silver once it approaches $50 again?” We will save analysis of this question for a future article, once silver is already demonstrated to be advancing toward the target.
Takeaway on Silver
Silver is within a bull flag continuation pattern, which will target $44 per ounce once the trigger level of $25 is broken.
From $25 to the $44 - $50 target will represent a near doubling in the silver price by 2025, or a 100% gain. Amidst this type of advance, we expect many silver miners, which are leveraged to the price of the underlying metal, to advance by 300% - 500% or more.
At www.iGoldAdvisor.com, we are preparing to purchase several precious metals-related investments. In addition to silver bullion, we plan to make highly-leveraged investments in silver miners via private placements, which offer investors free warrants in mining companies in addition to their shares, for even greater potential leverage.
It is still possible for silver to decline by several more dollars before the next advance begins. Any weakness toward $19 - $20 over the coming months should be used by investors as a high-probable chance to load up on silver-related investments before the move higher.
*********

Christopher Aaron began his career as an intelligence analyst for the CIA and Department of Defense. He served two tours to Afghanistan and Iraq between 2006 - 2009, conducting pattern-of-life mapping for military leaders.
Mapping shares similarities with technical analysis of the financial markets because both involve the interpretation of repeating patterns found in human nature. He is the founder of iGold Advisor, providing independent research and analytics on all aspects of the precious metals markets.
He speaks regularly on the cyclical patterns found within the financial markets and on international policy. He has been featured in the New York Times and NPR news amongst other financial publications.
More from Silver Phoenix 500


