Silver Price Forecast: Blast-Off or One Final Drop?


Gold has been hot this year, and for good reason: the Coronavirus pandemic, unprecedented bailout programs announced by the Federal Reserve and Treasury Department, and now riots developing around the United States have all contributed to the rise in bullion. For the year, gold is up $213 or 14% to close at $1,737 per ounce as this article is going to press.
What about the “other” precious metal – gold’s cousin – silver?
For the year, silver is down $0.27 cents or 1.5% to $17.65.
A disappointing performance for silver, no doubt.
Is the pain soon to end for silver investors? Will this be the time that silver finally follows gold and heads higher? Or is more languishing ahead?
In this article, we look at the silver market from a technical standpoint – with an emphasis on what ultimately matters most to the majority of investors: the silver price.
Ways to Analyze The Silver Market
One might analyze the silver market in a dozen ways.
For example, a thorough evaluation of supply and demand will show that over the past decade, approximately 80% of silver demand has come from industrial fabrication, namely from electronics, solar panels, and jewelry.
Meanwhile, on average only 20% of the silver extracted from the Earth each year is sold to investors.
One might spend years studying trends in the solar industry, or investor appetite for silver versus competing asset classes, all in an attempt to identify turning points for silver itself.
One might also focus on attempts by certain multinational banks to interfere with the proper functioning of the silver market. Manipulation attempts are not conspiracy theories, they are conspiracy facts, as discussed in this article from CNBC.
Still, an evaluation of silver by any one of these means alone in insufficient. How much of the silver market is manipulated? How elastic is jewelry demand when price rises? Will investors dump silver when it hits $50 again, as they did in 1980 and 2011?
The best way to analyze the market is not to spend a lifetime studying each one of these facets – it is to focus instead on what ultimately matters to most investors: price.
The Power of Price Trends
Studying price is simple and powerful. Everyone who buys and sells silver must do so at a single data point: the current price. Whether that buying or selling comes from legitimate investment demand, electronic fabrication, manipulation attempts, or jewelry – it all occurs at that one single point: the current price.
By studying price, we can observe the sum of the market in one instant. We can then cut through the emotion of any one fundamental supply or demand metric. We can see what is actually happening in a market, not what we wish might happen.
Silver Price
Below we show the silver price from 2010 through present, including the all-time high from 2011 matching the 1980 peak at $50 per ounce:
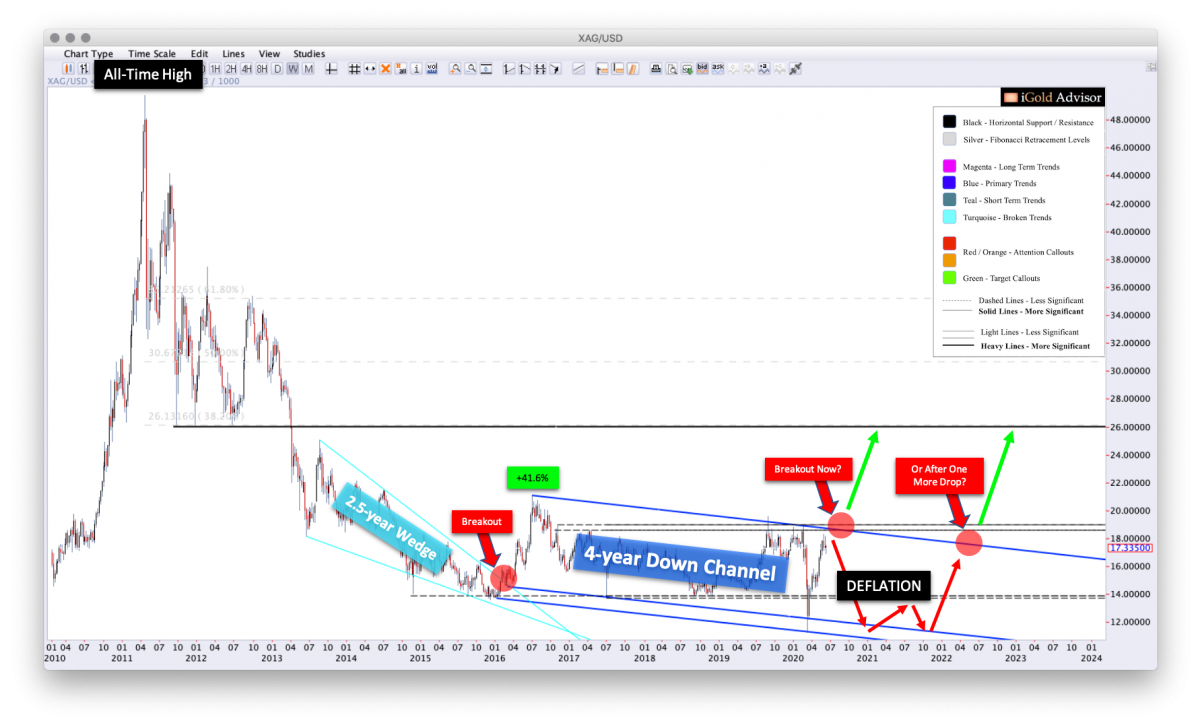
The most important aspect of silver’s current price trajectory is to note that the precious metal is still within a primary 4-year down channel (blue) until proven otherwise. This downward trend has featured a series of lower peaks every several years, in which sellers have emerged at lower and lower intervals.
Meanwhile, buyers have also continued to emerge at lower and lower prices every several years.
We could write an entire book on why they are selling and buying at lower prices, but the bottom line is this: they are.
The clarity of the 4-year down channel shows us that silver remains in a bearish configuration until proven otherwise.
What do we need to see to show us that silver may have a chance to begin a new bull market and eventually re-challenge the former all-time high at $50 per ounce?
A break of the upper declining boundary of the primary down channel (blue).
Presently, this make-or-break figure comes in at $18.60 in the spot market. A breaking of this figure would show us that, quite literally, the trend of lower prices had come to an end.
Such will be a critically significant trend break to watch for.
Silver’s Last Breakout
Notice that the last time silver broke a multi-year downtrend (turquoise), in April 2016, it then surged from $15.00 up to $21.25 (red callout). This was a 41.6% advance for silver in just three months.
In technical analysis, the rule for downtrend breaks is: “The steeper the trend, the less important the break.”
The converse of this rule is: “The shallower the trend, the more important the break.”
In the case of silver, note that the 2.5-year wedge (turquoise) which broke upward in 2016 was a rather steep trend. Thus, although the surge following the breakout was significant, it was mostly given back over the next three years.
In contrast, the present 4-year down channel (blue) is quite shallow. Thus, its breakout will be even more important, when it finally occurs.
In fact, our analysis suggests that this down channel (blue) will be the last such decline of the bear market which began in 2011. Following a breakout of this down channel, silver should begin a new advancing phase which will eventually see it re-challenge the $50 mark, and likely surpass this figure over the years ahead.
The key question: is silver ready to break out now?
Silver and Deflation
In a previous article, we showed that a twice-per-century signal has just registered in the global financial markets which predicts that a deflationary depression in the world economy is set to unfold over the next several years (link: https://www.gold-eagle.com/article/gold-price-forecast-twice-century-signal-says-depression-ahead).
The key question then in attempting to pinpoint the timing for silver’s final breakout is: how does silver perform during periods of deflation?
To do that, let us examine how silver has held up recently during the Coronavirus deflation and recovery:
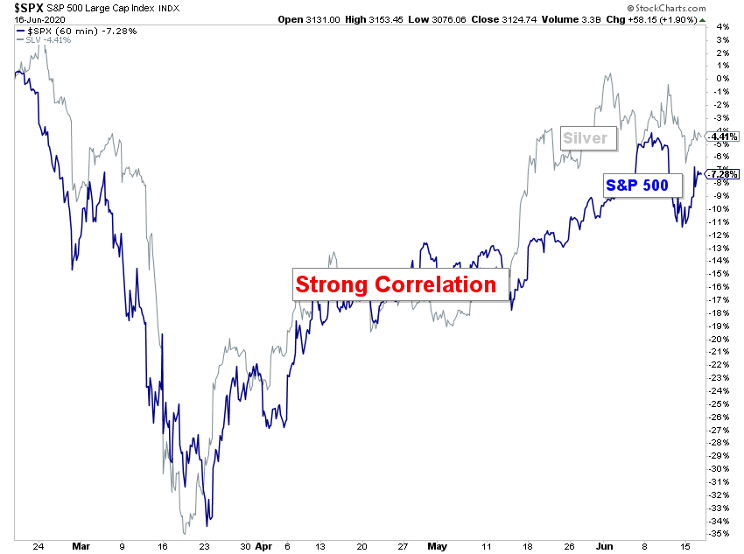
Note the strong correlation between the US stock market as represented by the S&P 500, and silver:
- Both silver and the stock market crashed a nearly equal -35% in six weeks during the Coronavirus panic.
- Both silver and the stock market bottomed within one week of one another.
- Both silver and the stock market have since recovered most of their losses.
It should be plain to see that during times of severe deflation and recovery, silver and the stock market are tied at the hip.
[Side note: why is this? Recall that currently, nearly 80% of silver is consumed by industry. Thus, when industry suffers as evidenced by a falling stock market, silver is generally dragged down with it.]
A Twice per Century Signal
Recall from our previous article that a twice-per-century deflation signal has just registered in world financial markets.
This twice-per-century signal will not end with a brief six-week stock market crash, followed by a near full recovery two months later.
What is due ahead is several years of significant trouble for world economies.
Remembering silver’s strong correlation with industrial stocks, one must logically ask: if equity markets continue to fall in late-2020 and into 2021, will silver be able to hold up?
Again, we must turn to the visible evidence shown above. Our best assessment is: no, silver will not be able to hold up during a prolonged stock market decline.
Thus, our highest expectation is that over the next 6 – 18 months, a further decline in silver is set to occur.
Following this final drop, and once stocks start to show stability indicating industry is churning again, we expect that silver will be amongst the premiere asset classes in the world, as inflation takes center stage on investors’ minds and silver begins to outpace gold.
However, that time is not yet now.
How Low For Silver Prices?
How low could silver fall during a worldwide depression?
Again, we turn to the visible evidence from the long-term chart, above.
Buyers have been stepping in every several years along a defined trend of support (lower blue boundary).
Our assessment is that during a period of severe deflation, silver could fall from present prices near $17.65 back toward the lower range of the visible support zone, between $10 - $12 per ounce.
In the grand scheme of things, a $5 to $7 further decline is not that severe, especially for an asset which has already fallen from $50 back in 2011.
In comparison, a return trip back to $50 would be more significant in percentage terms.
Still, a decline back to the lower range of the visible support channel could be catastrophic for those traders who are over-leveraged.
Further, most primary silver miners would be unable to operate at a profit at those prices, and would risk liquidation.
Thus, any entity at all involved in leverage with the silver market must be extremely careful at this juncture, should silver indeed get caught in a global deflationary spiral later this year.
Takeaway on Silver Prices
We expect a worldwide deflation to develop later this year and into 2021.
Silver has not shown evidence of being able to distance itself from the downward pull of industrial stocks or commodities.
In our work at www.iGoldAdvisor.com, we are focused on protecting capital with gold and other assets which will benefit during a global deflation. At the appropriate time once the deflation has ended, we will look to transition profits back into silver and silver miners.
Silver should top out below $18.60 spot this summer, and then begin to decline again back toward recent Coronavirus panic lows by late-year.
For those investors with patience, the time to get aggressive with silver will be into the next decline. We expect that, following stability in the industrial economy in 2021 – 2022, silver will be amongst the best performing assets in the world.
*********

Christopher Aaron began his career as an intelligence analyst for the CIA and Department of Defense. He served two tours to Afghanistan and Iraq between 2006 - 2009, conducting pattern-of-life mapping for military leaders.
Mapping shares similarities with technical analysis of the financial markets because both involve the interpretation of repeating patterns found in human nature. He is the founder of iGold Advisor, providing independent research and analytics on all aspects of the precious metals markets.
He speaks regularly on the cyclical patterns found within the financial markets and on international policy. He has been featured in the New York Times and NPR news amongst other financial publications.
More from Silver Phoenix 500


