Silver Price Forecast: Most Likely A Strong Decade Ahead


There is always a lot more attention on gold than silver.
Central banks primarily buy gold, rather than silver. Investors view gold as a safe haven, rather than silver. Gold is for kings and queens, while silver is for gentlemen and ladies.
Silver is more speculative. It is a smaller market, it is a primarily a mining byproduct of other metals rather than a directly-mined metal itself, and it is a metal that has both an industrial side and a monetary/jewelry side, with the industrial side being slightly larger. Electronic devices, electric vehicles, solar panels, and a variety of other industries use silver.
According to the Silver Institute, the annual supply and demand for silver hovers in the ballpark of one billion ounces per year. At current price levels, that means we’re talking less than a $20 billion annual market, which is tiny compared to the scale of global markets for stocks, bonds, and real estate. It is small enough that some wealthy individuals could corner the market, and it is a smaller figure than the annual revenue of typical S&P 500 companies.
However, when it moves, it can be explosive, and therefore it can make for a very interesting investment or hedge. This article takes a look at the expected range of returns that silver may provide in the following years.

Stocks vs Silver
One of the most known valuation metrics for the broad stock market, the cyclically-adjusted price-to-earnings (CAPE) ratio, was popularized by Yale economist Robert Shiller in the 1990’s. Rather than just focus on one year’s worth of earnings when calculating the average price/earnings ratio for the market, the CAPE ratio averages together the inflation-adjusted past ten years of earnings, and divides that average by the current price.
In other words, the ratio compares the current price of the S&P 500 to the typical earnings of the S&P 500 over the course of a full business cycle, which acknowledges the fact that earnings can be volatile, and one year’s worth of earnings is not necessarily representative of typical earnings.
The inverse version of that valuation metric is the cyclically-adjusted earnings yield, meaning that earnings are divided by price rather than the other way around. When the earnings yield is low, it means that stocks are historically expensive. Price is high relative to typical earnings, in other words.
The following chart shows the cyclically-adjusted earnings yield (blue line) compared to the ten-year annualized forward outperformance of the S&P 500 over silver (gray bars). When the bars are up, it means the S&P 500 outperformed silver from that point over the next decade. When the bars are down, it means silver outperformed the S&P 500 from that point instead:
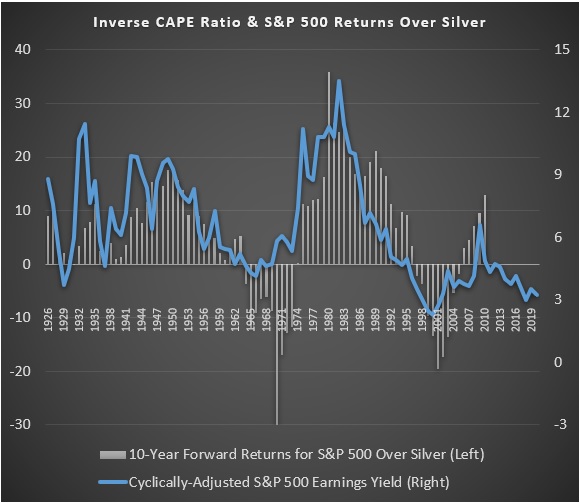
As the chart shows, stocks with dividends reinvested have outperformed silver over the long run and in most years. That makes sense; growing businesses that produce cash flow should outperform static commodities more often than not.
However, at historical points where the cyclically-adjusted earnings yield of the S&P 500 was very low (meaning stocks were very expensive), silver usually outperformed stocks over the next decade.
And silver rarely outperforms or underperforms by a little. The metal likes to be dramatic, with massive double-digit annualized outperformance or underperformance quite a high percentage of the time. It’s usually feast or famine with this metal; rarely in-between.
Currently, the cyclically-adjusted earnings yield of the S&P 500 is the second lowest it has ever been, with the dotcom bubble in 2000 being the absolute lowest. Meanwhile, silver is historically inexpensive; it is well below its previous peaks and is difficult to mine profitably at current price levels. If history is of any guide here, silver likely has a better decade ahead of it than the S&P 500, although in finance there are no guarantees.
I’m still bullish for the long run on some companies from current price levels. For example, I have a Top 7 Stocks to Buy and Hold article that I update annually. I tend to have an emphasis on value stocks and dividend stocks, meaning companies that have good fundamentals but are surprisingly inexpensive, and that preferably pay good dividends. But overall, there’s not a whole lot to like in the U.S. equity market at current price levels.
Gold vs Silver
Many investors are understandably concerned that if gold takes off, silver might or might not join it.
A century of data tells us that usually when the metals move, they move together, at least when one takes a long-term multi-year view rather than worrying about quarterly performance.
The following chart adds gold into the previous chart, showing that silver and gold forward decade-long returns over or under the S&P 500 tend to converge in the same direction:
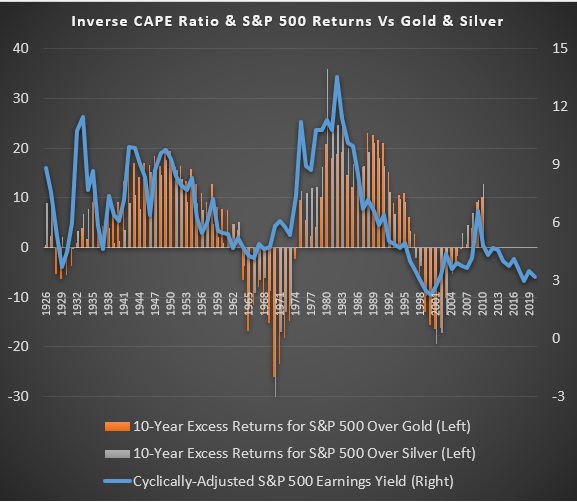
The big exception in this near-century of data was in the early stages of the Great Depression. Gold was tethered to the dollar early last century while silver was not, and therefore they behaved rather differently when the dollar was devalued against gold by the U.S. government. Gold did well by definition in dollar terms due to how many dollars it was pegged to, while silver floundered in a deflationary environment, with prices for most things in private markets falling in the early 1930’s.
So, except for when a shifted currency peg forced a difference, the contrast between gold and silver has been more about magnitude and precise timing rather than about general direction.
The popular gold-to-silver ratio is also somewhat informative about forward return differentials between the metals. It is a measure of how many ounces of silver it takes to buy an ounce of gold, with a higher figure meaning that gold is more expensive than usual compared to silver.
Historically and unsurprisingly, silver has tended to outperform gold over the following decade when it starts from a historically high gold-to-silver ratio:
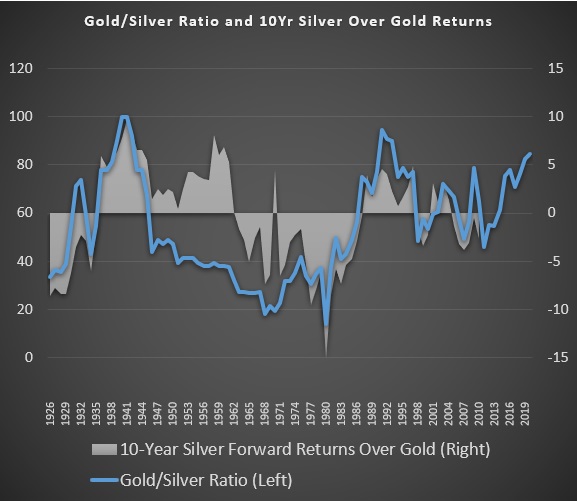
Specifically, whenever the gold-to-silver ratio has been over 70 or 80 as it is now, silver has historically been the better bet. If history is of any guide for today’s levels, silver would be expected to outperform gold by about a 5% annualized rate over the next decade, although it’s unlikely to be smooth.
If we go back to a moment to the earlier chart that showed how gold and silver price directions diverged from the late 1920’s into the Great Depression, the gold-to-silver ratio had been in the 30’s prior to that period of silver underperformance, which is rather low over this period.
Dollar Weakness is Key
In the short term, gold and silver trade like commodities, with big swings in price. Over the very long run, they are better thought of as stores of wealth. It is not so much that they go up in value; it is that currencies including the dollar decline in value relative to them.
The U.S. dollar, represented by the blue line below in a comparison to a basket of other currencies, is currently in a third cycle of strength in this post-1971 monetary regime:
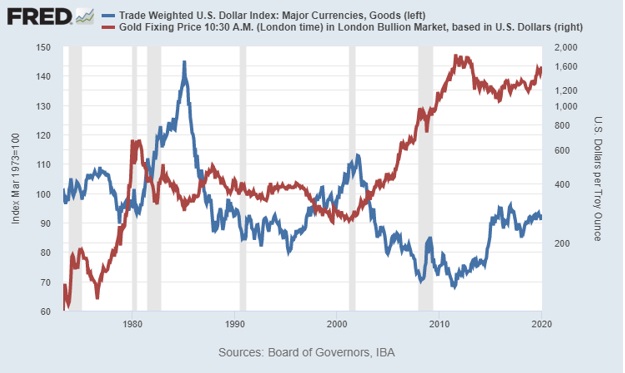
Chart Source: St. Louis Fed
In a number recent articles, including this one on Gold-Eagle, I explained my base case for a weaker dollar during the next several years.
Ever since late last summer, the Federal Reserve has reversed course on quantitative tightening, and has been effectively forced to fund U.S. government deficits through money creation. This next chart shows the Fed’s holdings of mortgage-backed securities (which they continue to be net sellers of) compared to treasuries (which they’ve suddenly been buying hand over fist lately):
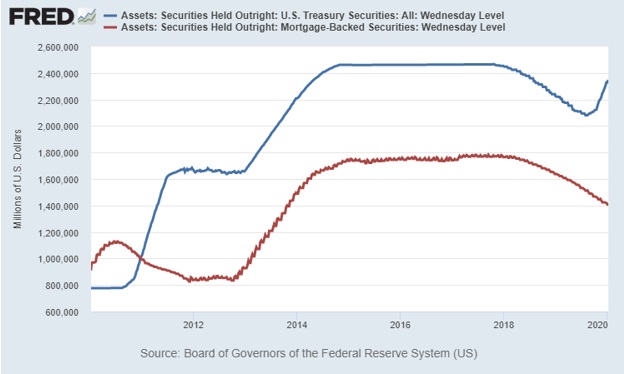
Chart Source: St. Louis Fed
With stocks historically expensive, interest rates historically low, the Fed having recently shifted from relatively tight monetary policy to extremely loose monetary policy, and silver still sitting rather cheaply after a long bear market, I’m particularly bullish on silver over the next several years.
There will be bumps along the way, and maybe one more big deflationary crunch to lower silver prices before the big rise, but I’m happy to continue buying on any dips and to maintain exposure to silver as a component of my globally-diversified multi-asset portfolio.


Lyn Alden has a blended finance and engineering background, and her investment strategy combines long-term value investing with a global macro overlay. She is the founder of Lyn Alden Investment Strategy and is a contributing analyst on Elliot Wave Trader.
More from Silver Phoenix 500


