Silver Price Forecast: Short-Term Charts Indicate Long-Term Bull Trend Moves


For most of 2019, the emerging trends in the precious metals space have been undeniably strong. Many analysts (possibly a majority of the financial analyst community) seemed to think that these types of events were impossible, given the fact that the S&P500 was on a clear course to continue posting record highs.
However, when this type of enthusiasm in equities reaches an extreme, it’s often a good idea to start looking at the precious metals space as a protective buffer against the growing potential for downside volatility. This was the basis for many of my bullish commentaries (and actual trades) during these periods and recent price moves have largely confirmed the accuracy of those forecasts.
If we take a long-term view of the SILVER/USD chart history (weekly), we can see that the initial surge in price activity became apparent during the May-June trading period. The first major signal that the paradigm had shifted developed once prices forcefully broke through the Ichimoku Cloud structure. Prior to this event, the most significant price lows formed toward the end of May (just below $14.30) and SILVER/USD soon rallied by more than 37.5% to reach new highs of $19.65 in roughly five weeks.
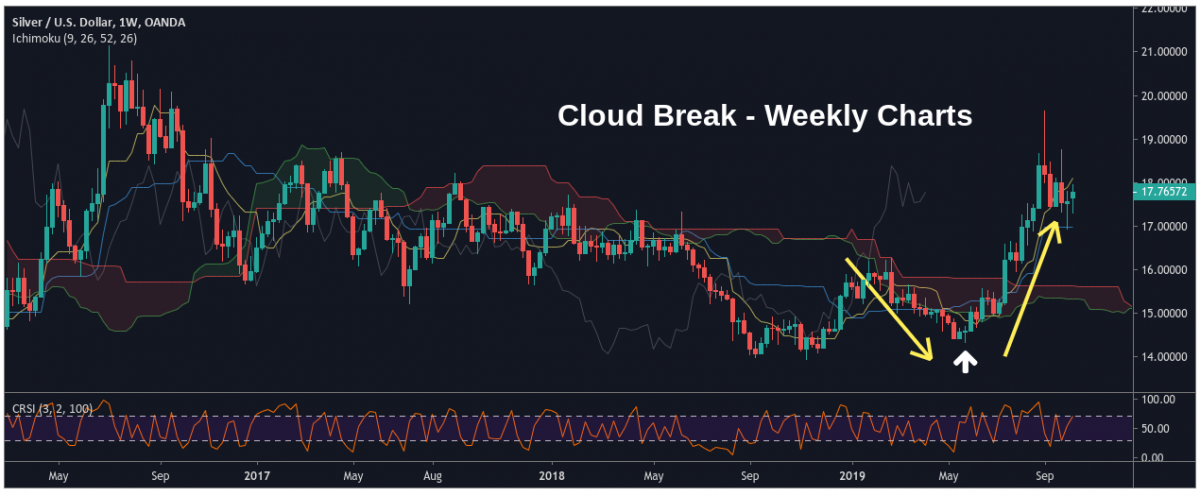
For some investors (particularly those focusing on cryptocurrencies), these rallies might not seem all that significant. However, we must consider the fact that SILVER/USD had been caught in a dramatic long-term downtrend that had produced very little upside price movement since July 2016.
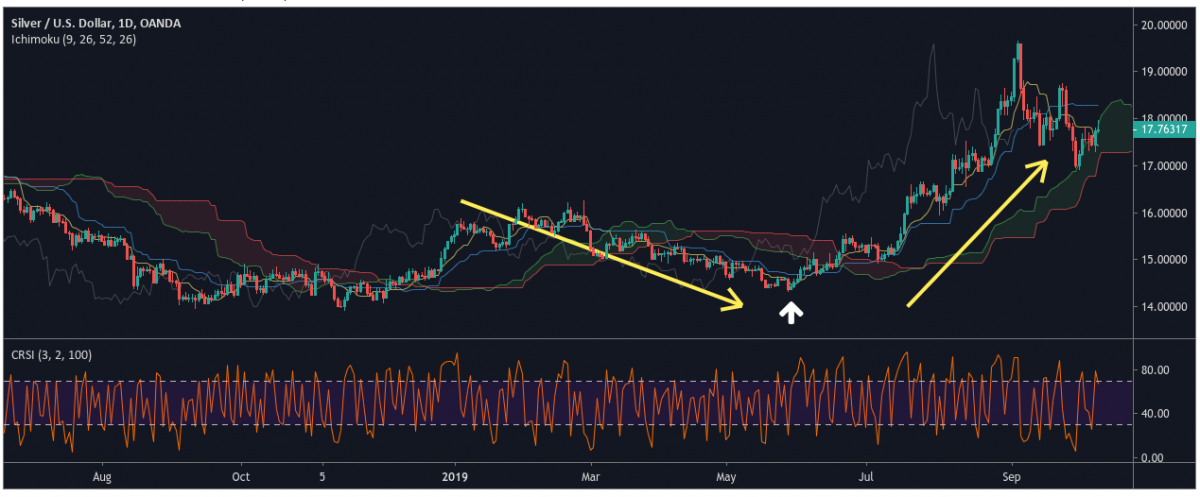
If we look at this same catalyst event on the SILVER/USD daily charts, we can see that Kumo support lies within close proximity to the current market valuation. This is another highly encouraging element for anyone bullish on assets tracking the value of silver. As long as markets can hold these levels (and not break downward through the Kumo), the implication is that SILVER/USD will be in a position to move above the September highs of $19.65.
Of course, all of that will depend on price performances seen in the shorter-term charts. Interestingly, we are starting to see similar events unfold on the SILVER/USD hourly charts (and this largely supports the broader thesis).
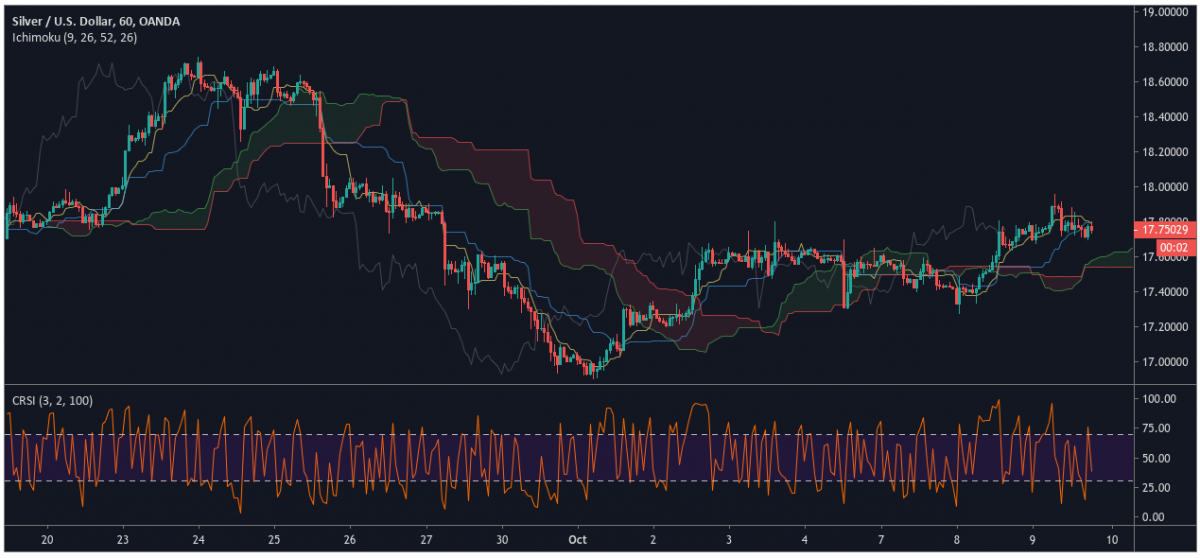
Traders that are familiar with the practice of Fractal Analysis might view these recent developments as particularly exciting, given the ways they suggest an extension of the prior bull move that generated the May-June price breakout in SILVER/USD.
What’s notable here is that the short-term Ichimoku Cloud break (on the hourly charts) shares many of the same features that were present during the May-June catalyst event. On the hourly charts, there is a bit more distance present between price and the Kumo, so this actually suggests we could still see some further downside without eroding the bullish bias for SILVER/USD.
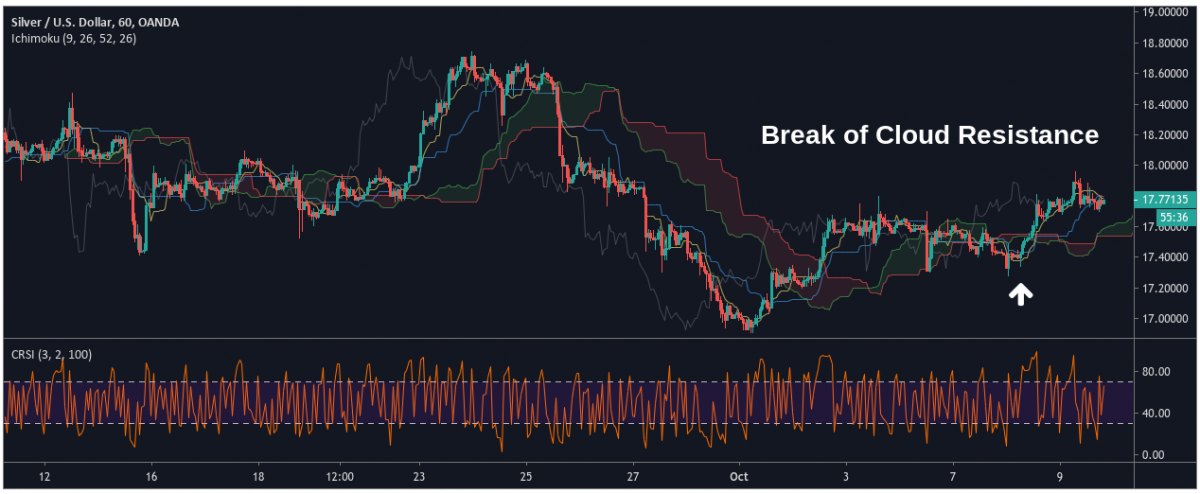
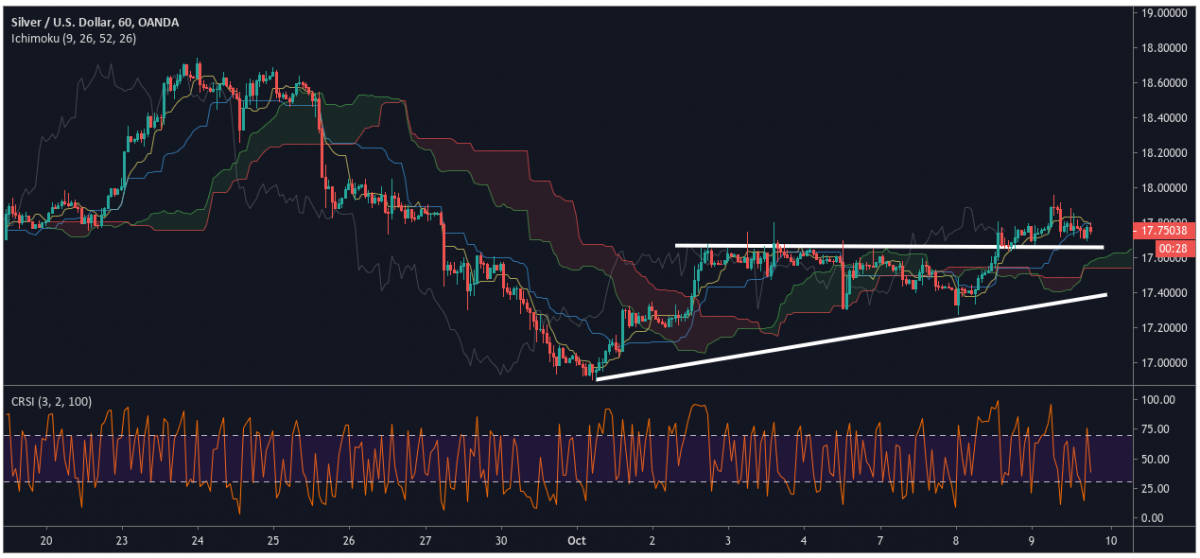
Furthermore, this recent break of cloud resistance on the SILVER/USD monthly charts was accompanied by an overbought surge in the Connors RSI indicator reading. When I use the Connors RSI indicator, I will generally look for bullish/bearish divergences rather than instances of price extremity. The reason for this is that the indicator tends to send many more signals when compared to the traditional RSI reading.
In this case, the Connors RSI projected upside price moves (based on the divergence) and this is another factor that points to an eventual re-test of the September highs. For more information on how I interpret these specific indicator readings, I encourage readers to review my Connors RSI Trading Tutorial for a more detailed explanation of how I conduct my price analysis.
*********
More from Silver Phoenix 500


