Silver Price Forecast: Silver Bottoming Almost Complete


The current silver bottoming process is very similar to that of 2001 to 2003. It took a while for silver to establish a base which set up the bull rally in the following years to 2011.
The current bottoming has been longer, but it fits the profile of the early 2000 bottom in many respects. Below, is a chart which show the similarity:
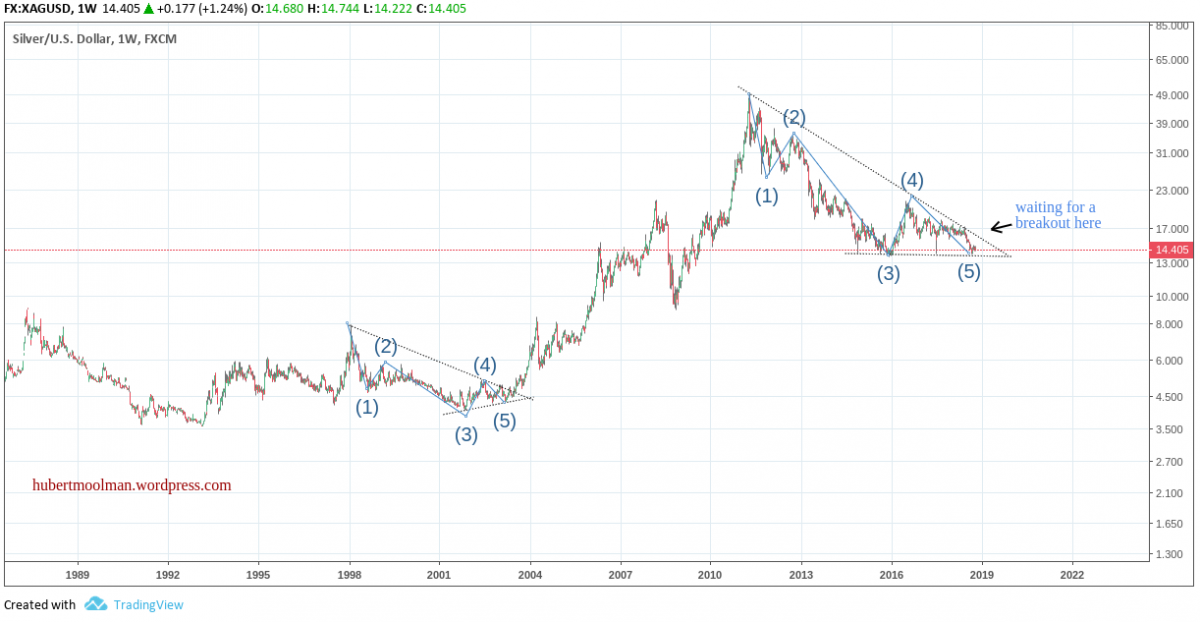
I have marked the two patterns (1 to 5) to show how they are similar. The current bottoming is coming to an end, and now a breakout of the top line of the triangle will confirm the validity of the comparison.
There also other fundamental similarities compared to the same period. The behaviour of the US Dollar index is an important one of them. Below is a comparison of silver and the US Dollar index chart:
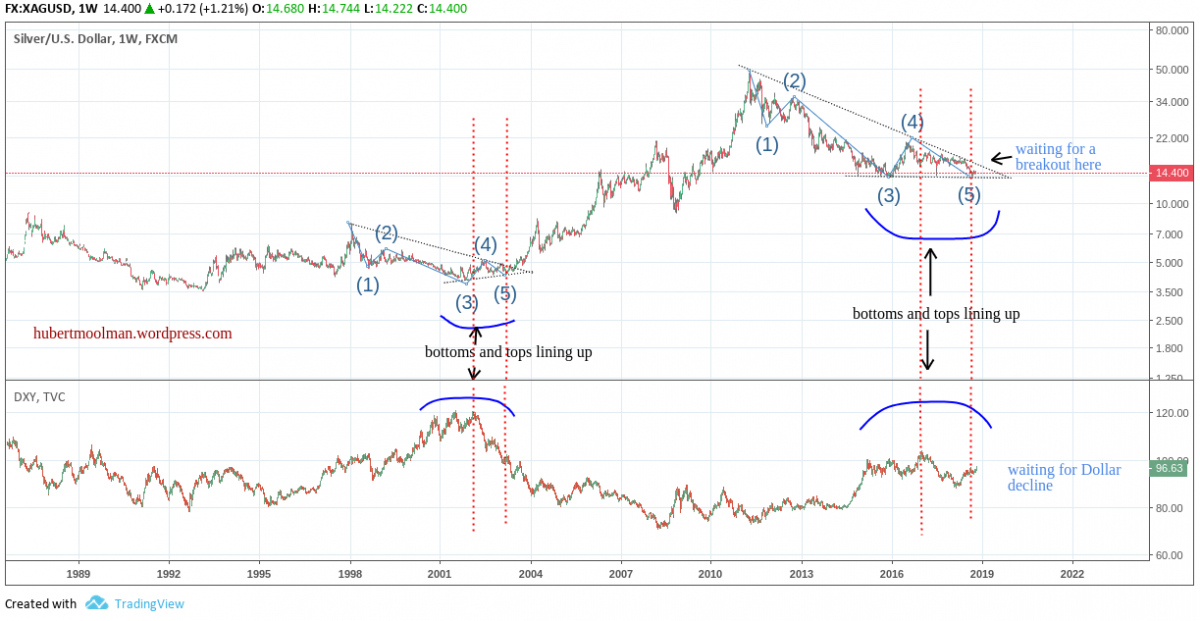
See how the bottoms and tops of the respective charts line up. Last year, when the US Dollar index was in decline (between the two dotted red lines), silver failed to rise.
This was also the case in 2002 (see between the two red lines). However, when the US Dollar continued into a deeper fall (after the two red lines), silver eventually started to rise significantly.
The Dollar is currently making its last attempts to go higher, before we will see a major decline. When that decline starts (which is likely to be soon), the silver price will take off a big way.
For more on this and this kind of fractal analysis, you are welcome to subscribe to my premium service. I have also recently completed a Silver Fractal Analysis Report as well as a Gold Fractal Analysis Report.
********


