Silver Price History - Dive Deep Into US Historical Silver Prices


Most of our website visitors are from the USA and for that reason, we will begin with charts covering the US dollar price of silver since the founding of the United States of America (USA).
In our nation’s historically brief +240 year history, the price of silver has swung from as low as 25¢ oz amid the Great Depression 1932-1933 to two various high points of some $50 oz in fiat Federal Reserve note valuations.
in both early 1980 and the early spring of 2011 the fiat US dollar price per troy ounce of silver was around $50 oz USD. You can learn more about those two specific silver price highs here.
In the following US silver price history chart, you will see the first price spike occurred during and just after the US Civil War ended and price manias in both silver and gold ensued. Perhaps much in part thanks to the large issuances of fiat currency Greenbacks to finance the Union's war victory.
The price of silver reached as high as $2.94 oz all the way back in the year 1864. By the year 1869, the cost of gold had done a near 8X multiple from its long-enduring $20.67 oz USD price when touching about $160 oz USD that fall.
Below you can examine some significant historical dates and charts for US dollar silver prices as well as current values versus the past.
We will begin with a US dollar silver price chart covering the more than the entire history of the United States of America to date.
Silver Price Chart Long-Term
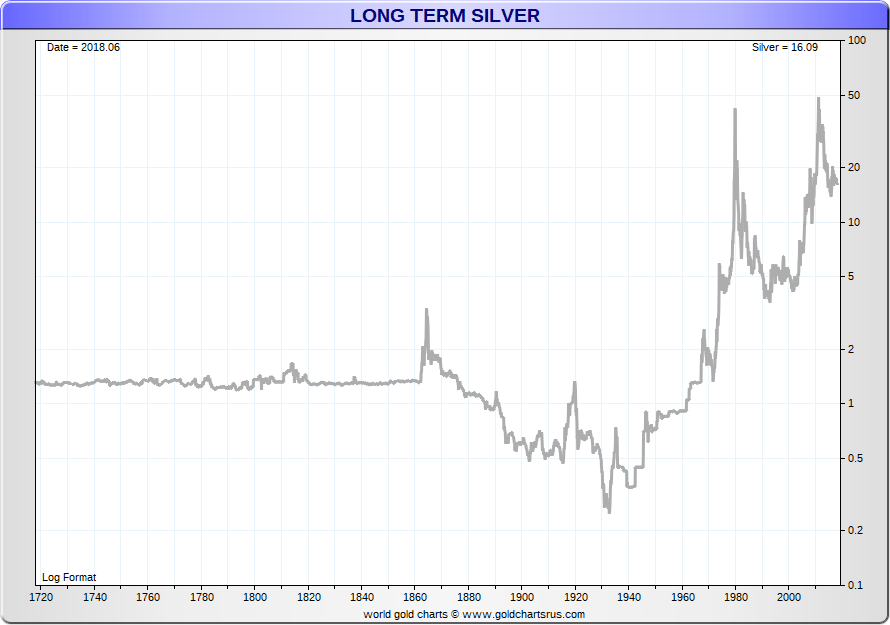
Silver Price History gets very volatile after the US Civil War and Silver Demonetization
For the majority of beginning non-war US history held a $1.29 oz USD price defined by the 1792 Coinage Act.
Price volatility changed significantly for US dollar silver prices during and following the Civil War era to today.
The following video clip, provided by the 'belangp' Youtube channel, is an overview of the Crime of 1873 and how silver was demonetized for many decades at the end of the 19th Century in the USA and around the world.
-
Silver Demonetization in United States' Cultural Context
Only 400 of these 90% silver quarters would have bought that roadster as delusional late 1920s Stock Market Bulls eventually lost 90% of their market's value.
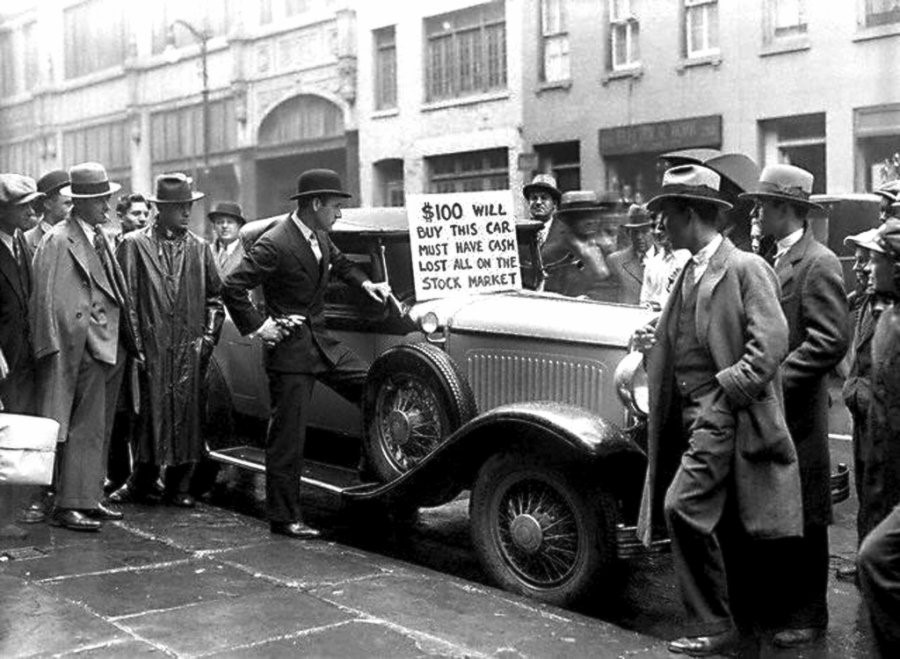
In the image above you can see losing stock speculator, Walter Thornton of New York, offering to sell his Chrysler Imperial Roadster for $100 USD, one day after the stock market crash (October 30, 1929).
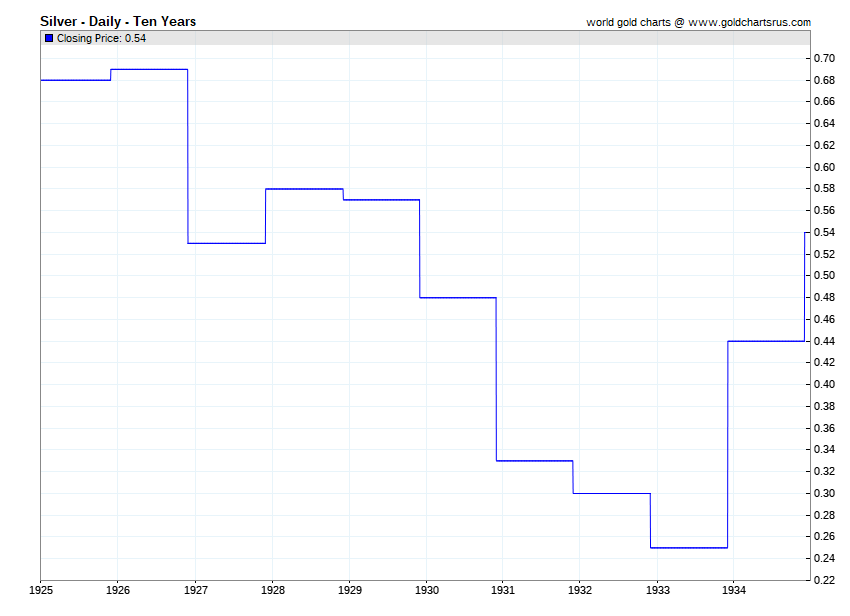
Lowest Silver Price in History? | 1934 Silver Nationalization - Executive Order 6814
The lowest silver price per troy ounce in US dollar terms was 25¢ oz reached in late 1932 and into the year 1933.
See this fact reflected in the brief silver price chart below spanning the end of the roaring 1920s into the 1930s Great Depression below.
It was not but months later that the then US President Franklin Roosevelt issued Executive Order 6814 nationalizing the domestic private and mined stock of silver at 50¢ oz USD.
The result of this was some 109 million oz (see page 268) of physical silver delivered to the US Treasury in 1934. Read more about modern silver nationalization and gold confiscations.
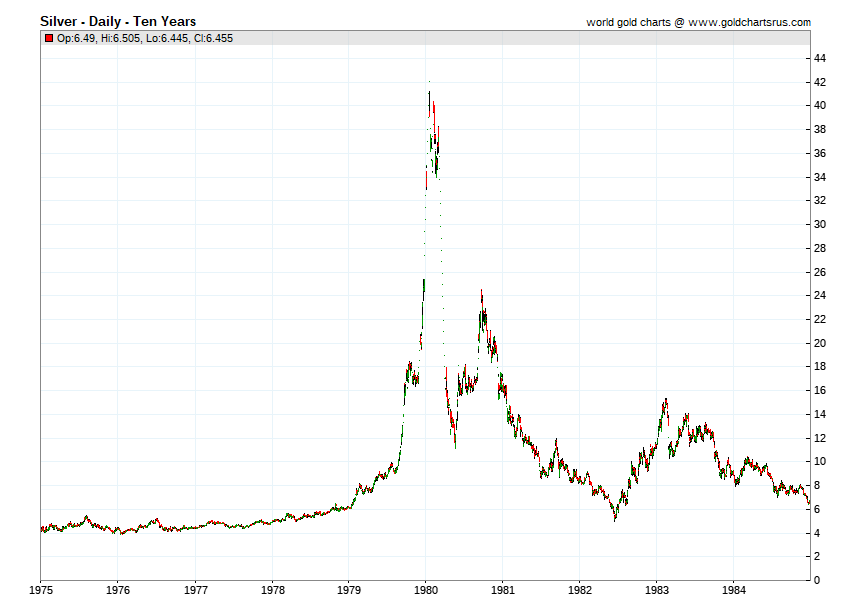
Silver Price Records: 1980 and 2011 Silver Price Nominal Highs of $50 oz USD
The highest prices for silver in US dollar (Federal Reserve note) terms are in the two charts below which span the respective 1970s and 21st Century silver bull markets respectively.
After the late 1960’s collapse of the gold price rigging London Gold Pool, the August 1971 Nixon Shock ushered in our current floating fiat currency exchange standard where silver prices seemingly generally gain value vs. fiat currencies over the long term.
Below is a chart of silver prices in US dollars during the years 1975 to the end of 1984. Note the price high in late January of 1980 for silver.
Silver Price Record 1980
Learn more about the 1980 Silver Price High Record
Next is a chart of silver prices in US dollars during the years 2005 to the end of 2014.
Within the following price chart, you will see silver's price run-up starting in late 2010 and into the spring of 2011 as silver's price went parabolic (almost straight up into April 2011).
Silver Price Record 2011
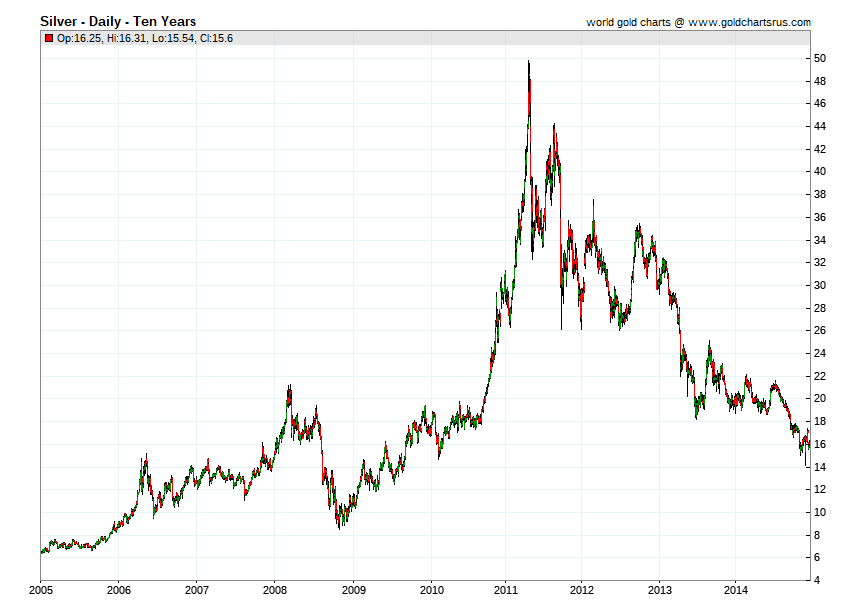
Learn more about the 2011 Silver Price High Record
Daily Silver Price Data 1968 - 2017
Click the year of your choice below for both Daily Silver Price History and Yearly Silver Price Charts throughout this ongoing Fiat Currency Era.
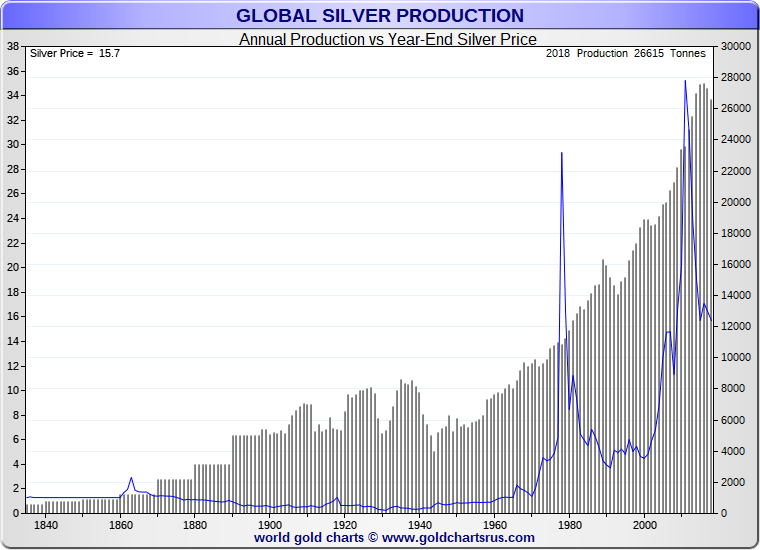
Silver Production Before and After the Industrial Revolution
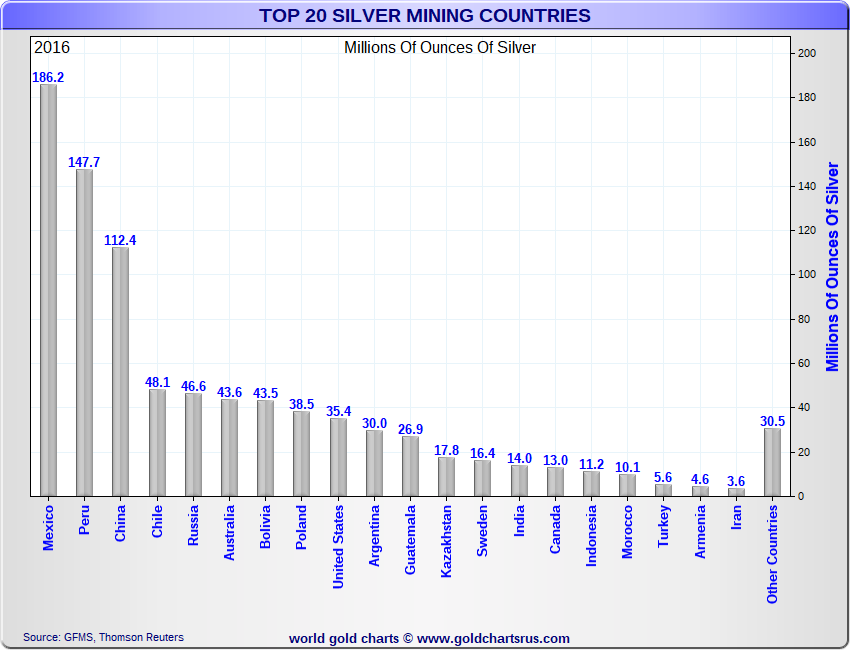
Silver Producing Nations Then
Silver Producing Nations Now
Silver vs Gold Mining Production History
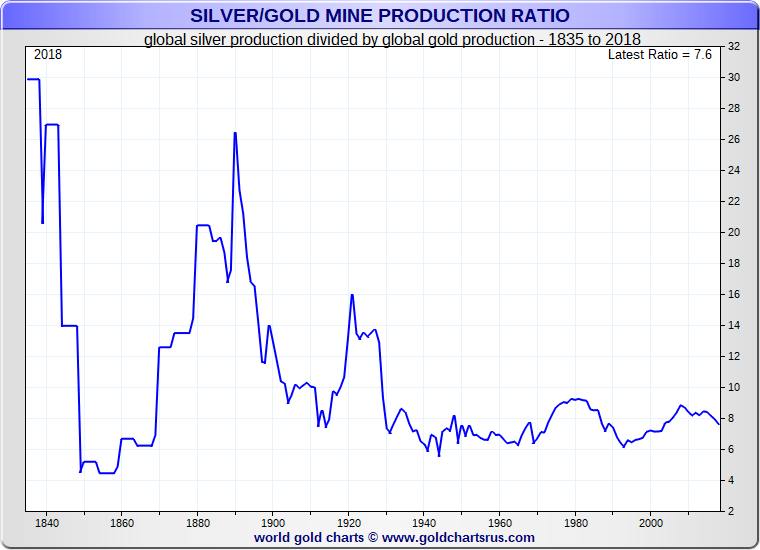
Historical Silver Prices vs. Gold
One of the best ways to understand silver’s trading value historically is to measure it against its precious monetary cousin, gold.
For this investors often use the historic Gold Silver Ratio to understand perhaps which metal is undervalued vs. overvalued short, medium, and even in the long term.
Here is a short definition of the Gold-Silver Ratio:
Gold Silver Ratio - (n) a moving ratio measurement of the amount of silver one can buy with a fixed amount of gold. Typically in the western world, the gold to silver ratio is measured by merely dividing the gold spot price by the silver spot price. It can be measured using equal like-kind weights: grams, kilos, tonnes, troy ounces, etc.
For recorded history, the gold-silver ratio has been as low as 2.5 to a somewhat recent all-time of about 100 in the early 1940s and 1990s.
The gold-silver ratio hit about 33 in the spring of 2011 and dropped to as low as about 16 as silver and gold prices peaked in early 1980.
As of producing this content, the gold-silver ratio has risen again near and even recently above 80. The following long term charts show the respective history of silver vs. silver price ratios in the USA and UK respectively.
Silver Price History Compared to Gold
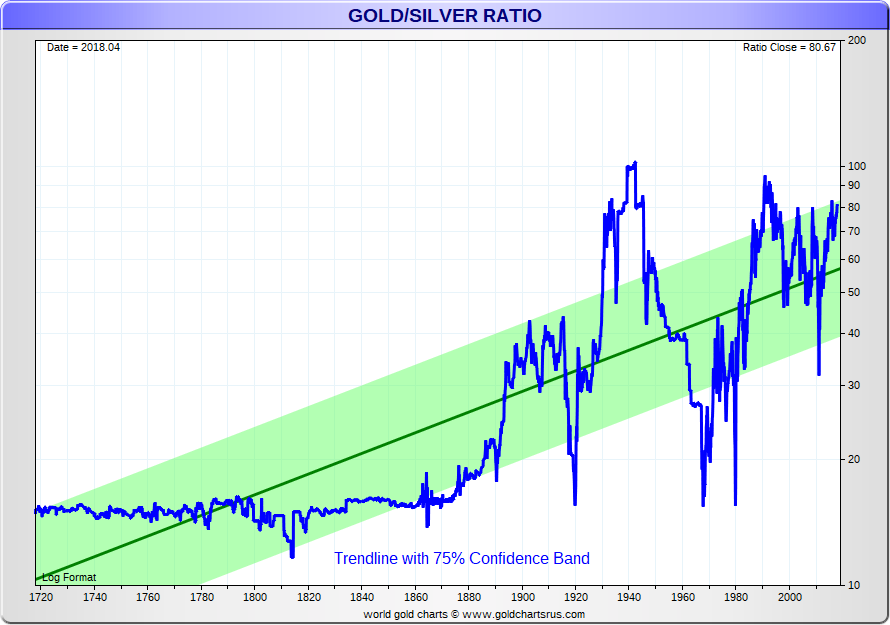
Silver Price History vs. Gold Longterm
The following content and historical data directly sourced from the book called ‘Silver Bonanza,’ authored by James Blanchard III released in 1995.
Mr. Blanchard was a successful businessman and a large driving force behind the ‘re-legalization’ of private gold bullion ownership in the USA in 1975.
Only recently have we learned through Wikileaks intercepted US cables that simultaneous efforts were ongoing to discourage US citizenry from buying and saving Gold Bullion long-term (but that is a COMEX silver price discovery topic of another post).
Below is nearly 5,000 years of Gold Silver Ratio data with a slight preamble of sources used:
The more ancient ratios are estimates for long periods. Those from 1600 to 1900 (AD) are yearly on periodic averages from Michael G. Mulhall, The Dictionary of Statistics, 4th ed. (London: George Routledge and Sons, 1899) and E.J. Farmer, The Conspiracy Against Silver, or a Plea for Bimetallism (New York: Greenwood Press, 1969; originally published 1886), p. 13.
The other statistics are from Steve Puetz’s Investment Letter, or from our own records. Statistics after 1900 are not yearly averages, but lows or highs that generally did not sustain for long periods. In 1980 the ratio stayed below 20 to 1 for the first two and a half months only, and touched under 16 to 1 for just a few days around January 21, 1980.
|
TIME FRAME / ERA |
Buy 1 oz Gold |
With X oz Silver |
|
Menes, Egypt 3200 BC |
1 |
2.5 |
|
Egypt, 2700 BC |
1 |
9 |
|
Hammurabi, Mesopotamia 2700 BC |
1 |
6 |
|
Egypt 1000 BC |
1 |
10.0 |
|
Croesus, Lydia 550 BC |
1 |
13.33 |
|
Persia under Darius, son of Hystaspes (father of Xerxes) |
1 |
13.0 |
|
Plato, ca. 445 BC |
1 |
12.0 |
|
Xenophon (in Persia) |
1 |
11.66 |
|
Menander, ca. 341 BC |
1 |
10.0 |
|
Greece, ca. 300 BC |
1 |
10.0 |
|
Rome, 207 BC |
1 |
14.5 |
|
Rome, 189 BC |
1 |
10.0 |
|
Rome, 40 BC, Julius Caesar |
1 |
7.5 |
|
Rome, Claudius |
1 |
12.5 |
|
Constantine the Great |
1 |
10.5 |
|
Theodosian Code |
1 |
14.4 |
|
Medieval England |
1 |
11.1 |
|
Medieval Italy |
1 |
12.6 |
|
TIME FRAME / ERA |
Buy 1 oz Gold |
With X oz Silver |
|
Spain, 1497 AD, Edict of Medina |
1 |
10.07 |
|
Germany, 1500 AD |
1 |
10.05 |
|
1600 - 1620 AD |
1 |
12.1 |
|
1700 - 1720 AD |
1 |
15.1 |
|
1800 - 1820 AD |
1 |
15.3 |
|
1821 - 1840 AD |
1 |
15.6 |
|
1841 - 1860 AD |
1 |
15.6 |
|
1861 - 1870 AD |
1 |
15.6 |
|
1871 - 1880 AD |
1 |
16.7 |
|
1881 - 1882 AD |
1 |
17.6 |
|
1883 - 1884 AD |
1 |
18.4 |
|
1885 - 1886 AD |
1 |
19.9 |
|
1887 - 1888 AD |
1 |
21.2 |
|
1890 AD |
1 |
18.3 |
|
1932 AD |
1 |
75.0 |
|
1940 - 1941 AD |
1 |
100.0 |
|
1980 AD |
1 |
16.0 |
|
1991 AD (February) |
1 |
100.0 |
|
1994 AD (July) |
1 |
73.25 |
Silver Price History England
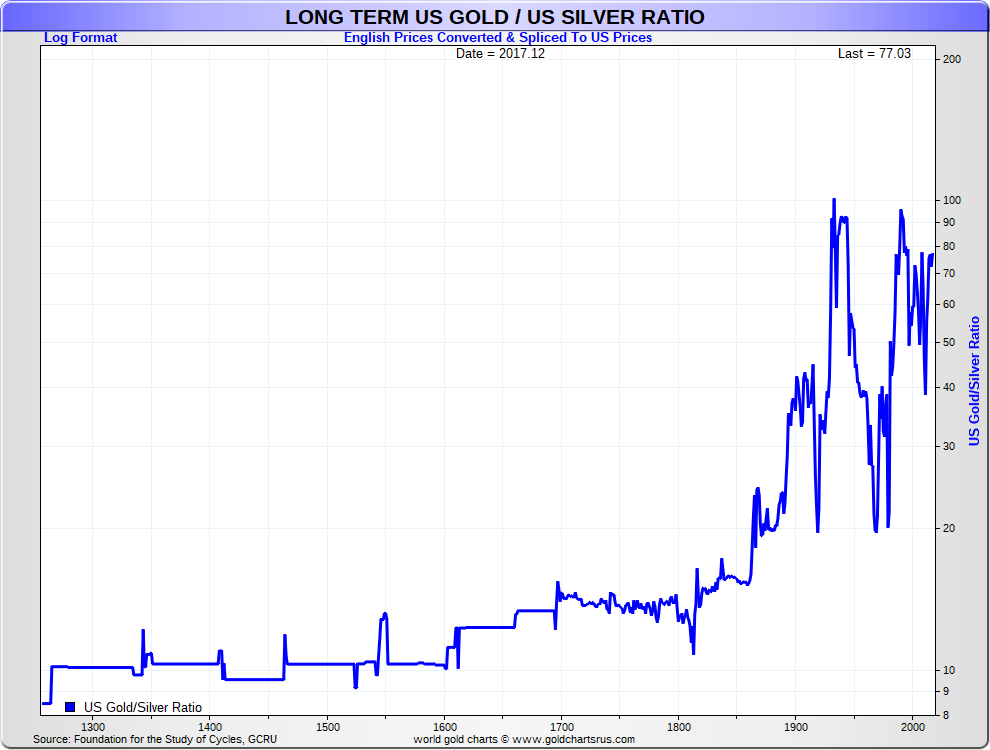
+700 year Gold Silver Ratio English Prices spliced to US dollars
The following Gold Silver Ratio 700-year chart uses English historical prices spliced into US dollar prices.
With the industrial revolution and expanding government central bank price-fixing, the value of gold vs. silver has mostly widened over the last +100 year history.
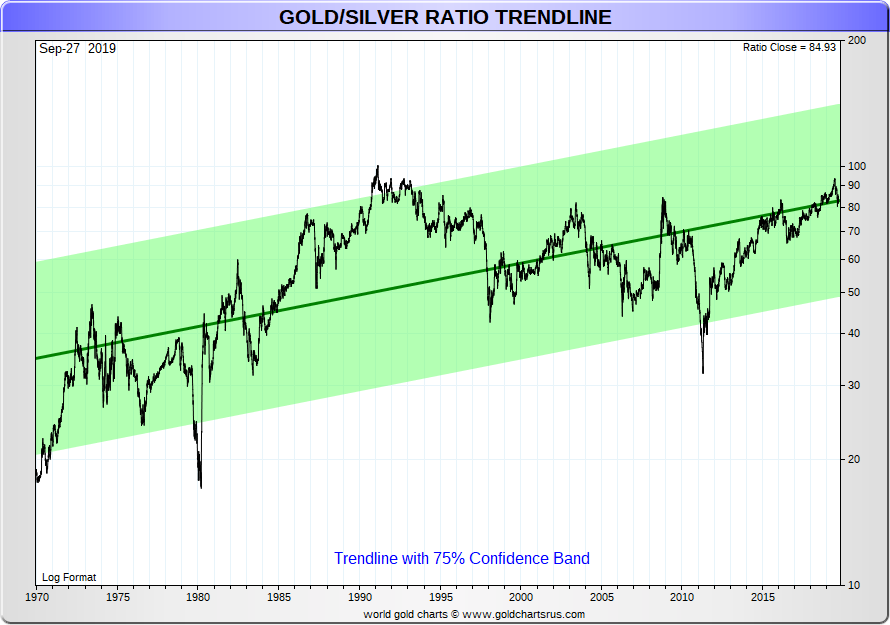
The following Gold Silver Ratio chart focuses on the current full fiat currency era we are living in since the end of the Bretton Woods agreement and gold exchange monetary standard.
The last time we dipped below the green trendline was during the 2011 silver, and gold nominal record price runs with a gold-silver ratio of about 33 being the interim low of the last few decades.
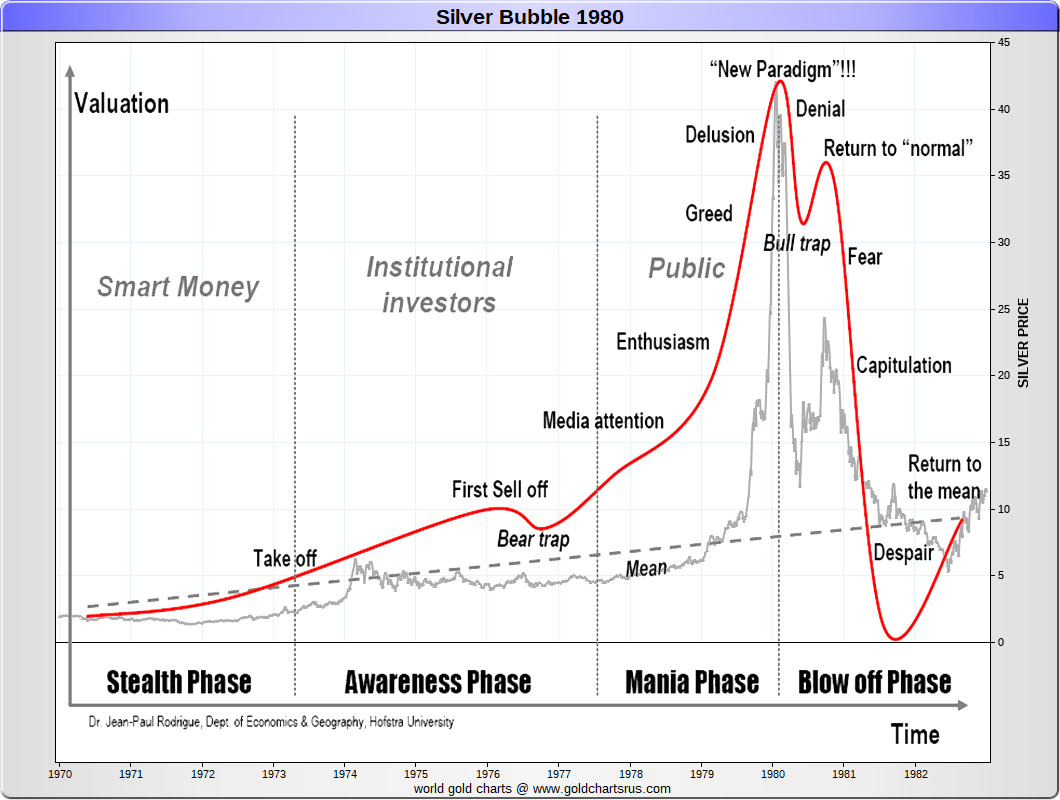
Next chart covers the last major bullion bull market before this 21st Century Gold Rush began in the early 2000s.
The next price peaks of all 4 major precious metal prices occurred within months of one another in the first half of 1980 (gold and silver, followed by platinum and palladium respectively).
Hawkish Federal Reserve policies of near 20% interest rates were possible at the time given the respective lower levels of debt throughout the economy at the time.
Today our global record debt levels and fundamental economic factors are profoundly different than they were in 1980.
In the ongoing silver bullion vs. US dollar value war, we are now more and more likely to see even steeper negative real interest rates and further fiat currency debasement as the primary mechanisms in future debt defaults and debt supercycle restructuring.
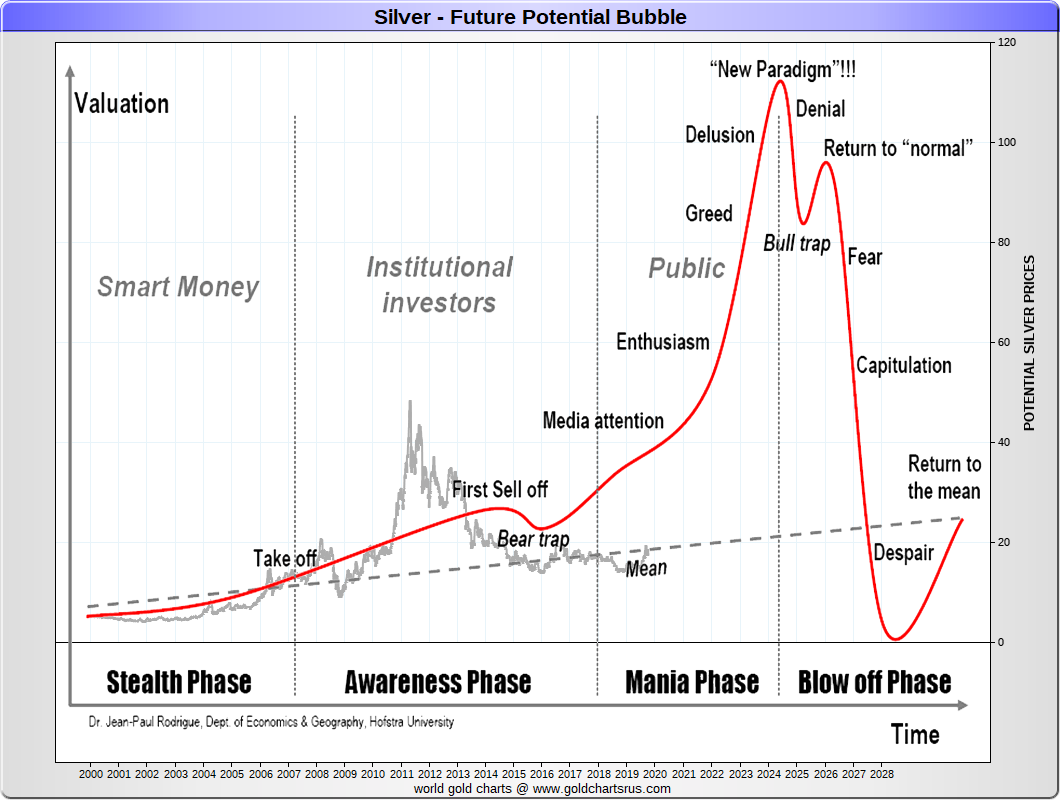
Many industry experts expect the 2020s to be great years for both gold and silver values respectively. Even going so far as to say new nominal record prices will ensue from 2022 to 2024 with another global financial crisis being the catalyst.
The following is a potential roadmap under such a scenario. Time will, of course, tell if the road ahead for silver possibly plays out like so.
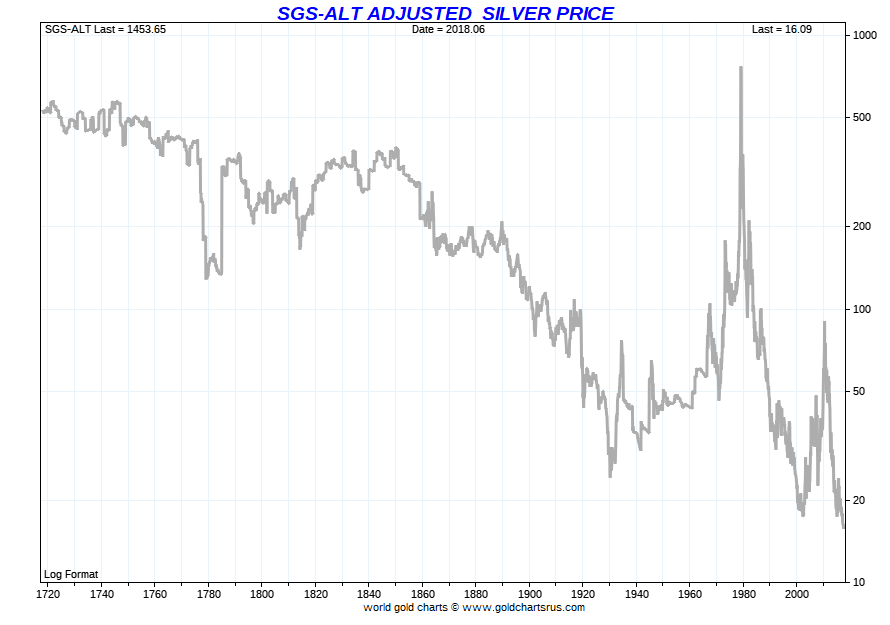
Historical Silver Prices Adjusted for Real Price Inflation
Finally, we will use the most accurate historical inflation data available produced by ShadowStats to better understand silver’s US dollar value for our nation’s history.
The chart below uses the ShadowStats Alternative CPI-U Measure which is an attempt at adjusting government benefiting CPI-U inflation underreporting which has widened since 1980.
Alterations in methods used to report inflation have drastically changed over recent decades in the United States. They were likely designed to move the concept of the CPI (core price inflation) away from being a measure of the cost of living needed to maintain a constant standard of living to one which allows the government to under-deliver on promises made.
This real inflation Silver Price Chart value data uses more accurate price inflation reporting methods in place as of 1980.
According to the following chart, ongoing fiat US dollar silver price values are lower now than even in the year 2000 (using fiat US dollar real inflation data).
Silver was most expensive in United States history in late January 1980 using real price inflation data.
Silver Price History vs Inflation
You can always find fresh up to date silver price information on our live silver price page. For daily US dollar silver price quotes and data, you can search the last 50 years of data there.
Be sure to bookmark them both if daily silver price history and information are essential to you.
In our opinion, these last 50 years of silver price data are most important, relative to the somewhat recent time that they cover historically. The last near 5 decades of our continued time living under a full fiat global monetary order.
*********


