Silver Price Spikes, But What Demand
 share
share
 share
share
 share
share
 share
share
 share
share
 For a few frenzied minutes, while everyone was sleeping, the price of silver spiked 56 cents. Well, at least the West Coast of America was sleeping. It began at 8:30 in New York, where presumably most traders were not sleeping. And of course, it was afternoon here in London (where Monetary Metals just held a seminar). The catalyst was a news release: the non-farm payroll numbers.
$0.56, or 3.8%, is a big move for a whole day. It happened in 15 minutes (and most of the move occurred during 3 distinct minutes).
In addition to the big price move, there is one other fact silver analysts are pondering. There is a real shortage of silver coins.
Let’s digress for a moment. We are not exactly known for our belief in the rumors that often swirl around precious metals. How do we know for sure that coins are scarce? We watch spreads. There is always a spread (called a premium in this market) between coins and spot silver. Here’s a graph of the Eagle premium asked by Monex.
The Silver Coin Premium (Source: Sharelynx)
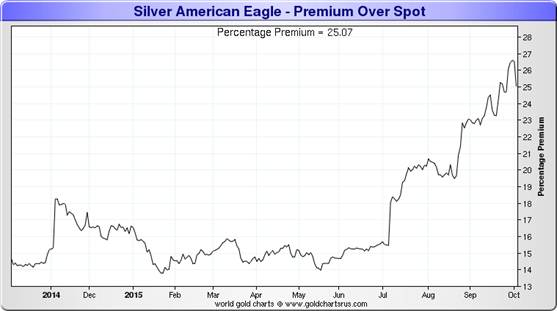
The spread has nearly doubled since July. An ounce of silver in the form of an American Eagle is selling for around $4 more than the same metal when it’s in the form of a 1000oz bar. That’s up from about $2. A big change.
This paints a picture of a desperate urgency of people to buy silver, but only in the form of coins. To put it in other words, it is a rising preference for coins over other forms of silver.
The obvious question is: does this show strong demand for physical silver metal? Our answer is “yes, but.”
Yes: there is clearly demand for silver coins.
But: the capacity to produce silver coins is inelastic. Manufacturers can only stamp them out so fast (and they have little reason to increase capacity, as they know that demand can dry up just as suddenly as it appeared, but capital equipment has to be amortized over many years).
As coins are bought (and presumably stacked, not to return to the market any time soon), this is demand for silver metal. However, it is like pulling liquid from a large pool through a thin straw. Yes, it’s drawing liquid out of the pool. But the straw can only flow so much.
Read on, for a deeper look into gold and silver supply and demand fundamentals…
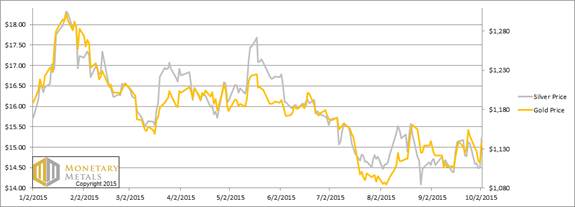
First, here is the graph of the metals’ prices.
The Prices of Gold and Silver
We are interested in the changing equilibrium created when some market participants are accumulating hoards and others are dishoarding. Of course, what makes it exciting is that speculators can (temporarily) exaggerate or fight against the trend. The speculators are often acting on rumors, technical analysis, or partial data about flows into or out of one corner of the market. That kind of information can’t tell them whether the globe, on net, is hoarding or dishoarding.
One could point out that gold does not, on net, go into or out of anything. Yes, that is true. But it can come out of hoards and into carry trades. That is what we study. The gold basis tells us about this dynamic.
Conventional techniques for analyzing supply and demand are inapplicable to gold and silver, because the monetary metals have such high inventories. In normal commodities, inventories divided by annual production (stocks to flows) can be measured in months. The world just does not keep much inventory in wheat or oil.
With gold and silver, stocks to flows is measured in decades. Every ounce of those massive stockpiles is potential supply. Everyone on the planet is potential demand. At the right price, and under the right conditions. Looking at incremental changes in mine output or electronic manufacturing is not helpful to predict the future prices of the metals. For an introduction and guide to our concepts and theory, click here.
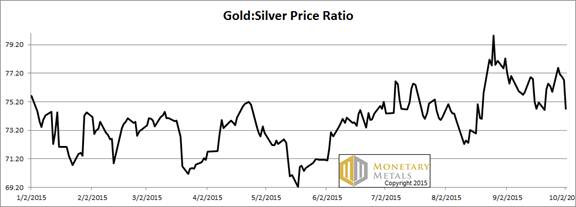
Next, this is a graph of the gold price measured in silver, otherwise known as the gold to silver ratio. The ratio moved down this week.
The Ratio of the Gold Price to the Silver Price
For each metal, we will look at a graph of the basis and cobasis overlaid with the price of the dollar in terms of the respective metal. It will make it easier to provide brief commentary. The dollar will be represented in green, the basis in blue and cobasis in red.
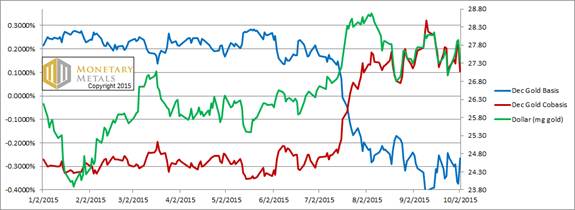
Here is the gold graph.
The Gold Basis and Cobasis and the Dollar Price
Last week, we said:
“Look at that incredible correlation between the price of the dollar (inverse of the commonly accepted price of gold) and the gold cobasis (i.e. scarcity indicator)! Since mid to late august, they have been tracking almost perfectly.”
What does this mean? It means as the dollar drops (i.e. the gold price rises) gold becomes less scarce. As the dollar rises, gold becomes scarcer. For now—we emphasize this is not a permanent feature of the gold market!—the gold market is moving like any commodity market. A lower price encourages buying and discourages selling. A higher price is the opposite.
The same is true this week.
The price of gold ended the week down, but not by much. Unsurprisingly, the fundamental price moved but $2 (still way over the market price).
Now let’s look at silver.
The Silver Basis and Cobasis and the Dollar Price
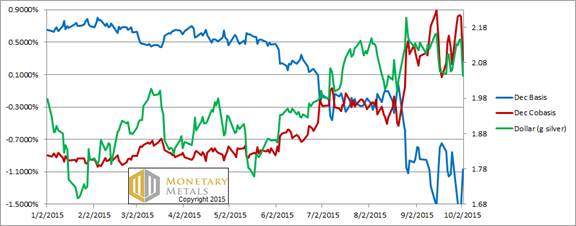
Silver also shows the same basic pattern. The price of silver dropped and then spiked sharply on Friday, ending the week up 13 cents.
However, the cobasis (i.e. scarcity) fell. A lot. In fact, it is the biggest drop in the silver cobasis in years.
For the December contract, the decarry (the profit to be earned by selling a bar and buying a future) fell by about 1.9 cents. On Thursday, one could earn about 2.9 cents but on Friday after the price of silver jumped up, the profit from the same trade was only about a penny.
Speculators bid up the price of futures so fiercely and so aggressively, that the spread between December and spot was compressed to about 1/3 its previous size. *WHUMP!*
Let’s revisit the coin premium, this time overlaid with the continuous silver cobasis.
The Silver Coin Premium with Cobasis
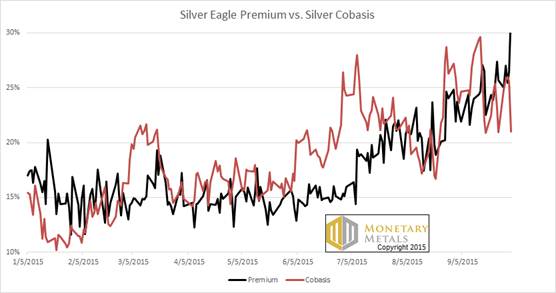
This graph shows that there is a correlation, but it’s weak (the R^2 coefficient is 0.4). We interpret this to mean that sometimes the same market forces that are driving silver into scarcity can also drive coin stackers, but it does not work so well the other way. Stackers can’t pull enough silver through that thin straw, to cause any serious scarcity in the bullion market. Though they can exacerbate scarcity if it’s already rising.
By our calculation, the market price of silver is at or above its fundamental.
********
Monetary Metals is sponsoring a seminar in Sydney on Oct 28, to discuss economics and markets, with a focus on how to approach saving, investing, and speculating. Please register here.
© 2015 Monetary Metals
share
share
share
share
share
 Dr. Keith Weiner is the CEO of Monetary Metals and the president of the Gold Standard Institute USA. Keith is a leading authority in the areas of gold, money, and credit and has made important contributions to the development of trading techniques founded upon the analysis of bid-ask spreads. Keith is a sought after speaker and regularly writes on economics. He is an Objectivist, and has his PhD from the New Austrian School of Economics. His website is www.monetary-metals.com.
More from Silver Phoenix 500