Silver Price Update


The last Silver Market update almost a month ago called the intermediate top within a day, as you may recall, and it has back to the extent predicted in that update.
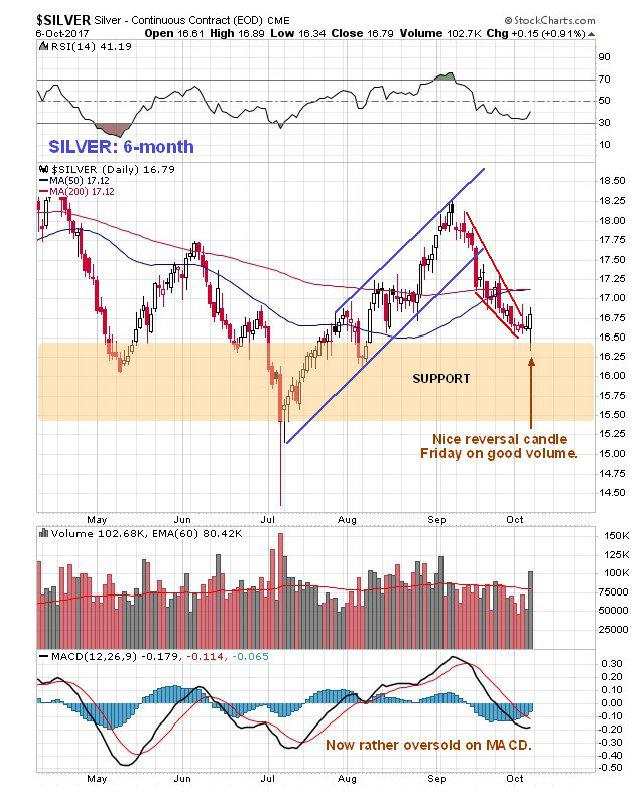
There was more evidence of a turn in silver than gold on Friday, when a more obvious reversal candle appeared on its chart. On the 6-month chart we can see that a long-tailed candle occurred that approximates to a bull hammer where the price closed not far off the day’s highs on the biggest volume for over a month. After its recent reaction this certainly looks like a reversal, especially as the downtrend channel has been converging. The earlier overbought condition has more than fully unwound and the price has dropped back into a zone of support.
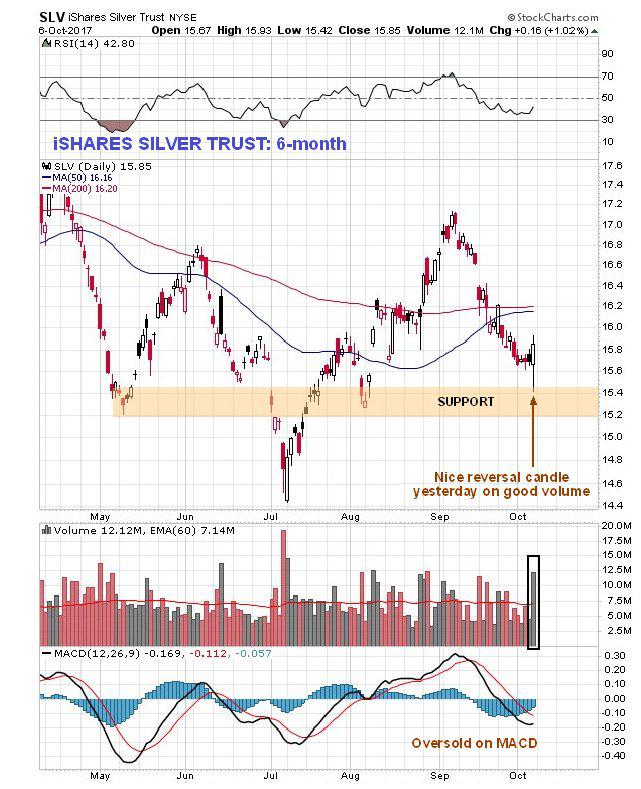
There was an even more pronounced reversal candle on Friday in silver proxy iShares Silver Trust…
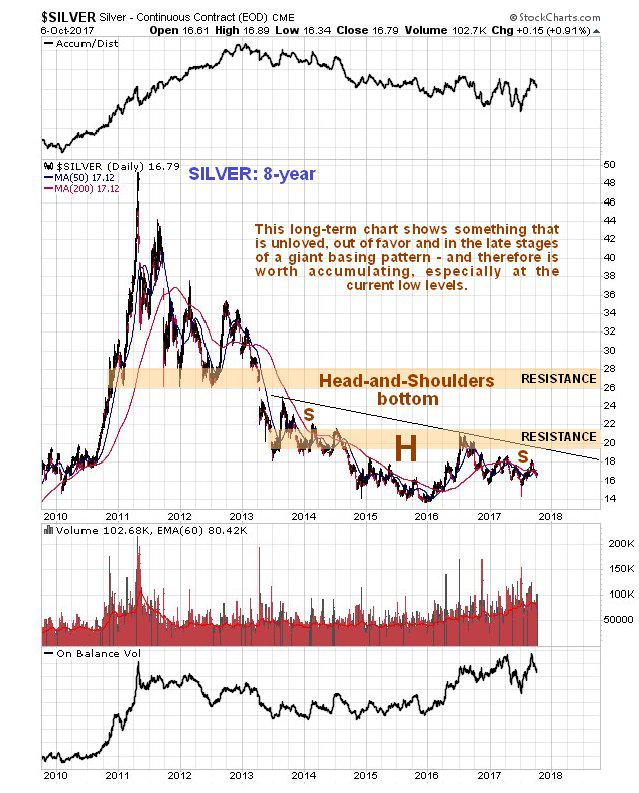
Like gold, silver is marking out a giant Head-and-Shoulders bottom pattern, but in silver’s case it is downsloping as we can see on its 8-year chart below, which reflects the fact that silver tends to underperform gold at the end of sector bearmarkets and during the early stages of sector bullmarkets. Prolonged underperformance by silver is therefore a sign of a bottom. This chart really does show how unloved silver is right now, but although the price has drifted slightly lower over the past several years, volume indicators have improved, especially this year, a positive sign. A break above the neckline of the pattern, the black line, will be a positive development, and more so a break above the band of resistance approaching the 2016 highs. Once it gets above this it will have to contend with a quite strong zone of resistance roughly between $26 and $28. Silver is amongst the most unloved of all metals, a situation that is not expected to continue, partly because silverbugs are manic-depressive and they have been depressive for a long time, meaning that it surely won’t be all that long until they are on the rooftops singing Happy Days are Here Again.
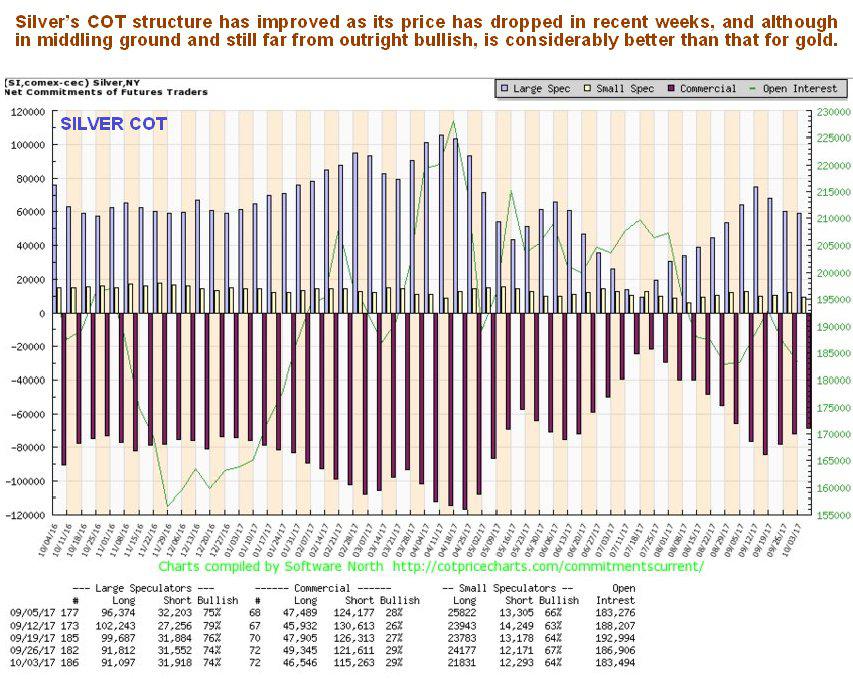
As with gold, silver’s COT structure has improved in recent weeks as the price has dropped, and although readings are still far from levels that can be described as outright bullish, they are considerably better than those for gold, which could be a sign that silver is set to outperform gold at last…
Click on chart to popup a larger clearer version.
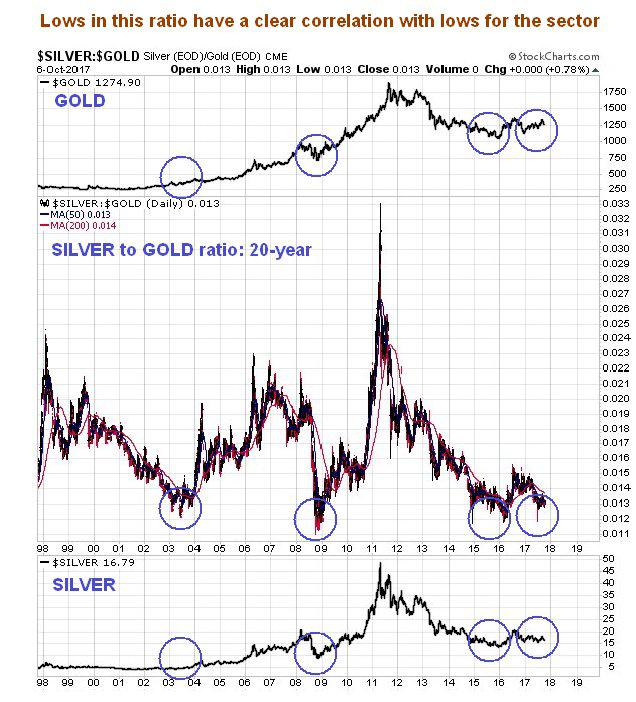
Extreme lows in the silver / gold ratio are reliable indicators of either a sector bottom or they can occur during the early stages of a sector bullmarket, as can be seen on the long-term silver over gold chart shown below, which goes back to late 1997. When a low in this ratio occurred in 2003, the sector was already in a bullmarket, but as we can see, it had much further to run. The next major low followed the 2008 market crash. More recently the ratio plumbed very low levels again at the end of 2014 and early in 2016, which marked the sector bottom after the brutal bearmarket from the 2011 highs. Right now it is only a whisker above these lows, which is a strong sign that another bullmarket is just around the corner.
********
More from Silver Phoenix 500


