Silver Price Update: For Silver To Head Higher, This Is A Key Level


Even though the silver price has sold off today, it doesn’t mean the rally that started two weeks ago is over. While the silver price was down more than 40 cents today, it may be retesting a support level before heading higher. However, it doesn’t help that it took two weeks for silver to go up more than 70 cents, but then fall 30+ cents today.
Regardless, traders and algorithms follow certain technical price levels. Thus, the silver price was trading in a falling wedge pattern for the past four months before breaking out of that trend last week. Typically, a falling wedge pattern is bullish. Yes, it sounds counter-intuitive, but falling wedges are more bullish to the price action while rising wedges are bearish.
A perfect example of a rising wedge is shown in one of the Northman Trader’s (Sven Heinrich) charts on the NASDAQ a few weeks ago:
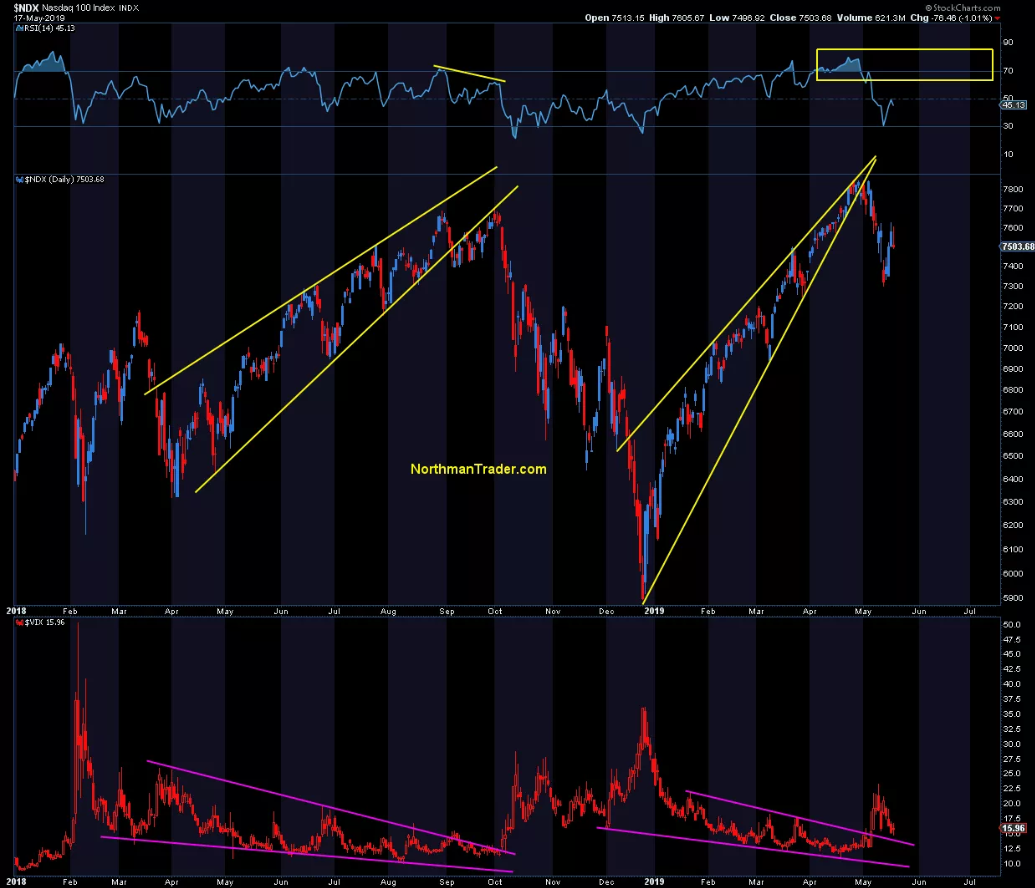
NOX 100 Index
As you can see, as the NASDAQ Index fell below its rising wedges, the price action was bearish. Sven at NorthmanTrader.com has been doing excellent updates on these rising wedges and technical setups for the broader markets. Furthermore, Clive Maund, precious metals technical analyst, recently did a Silver Update stating that he thought the silver price would drop considerably along with the broader markets. According to Clive’s technical analysis, silver fell below its falling wedge, which is bearish.
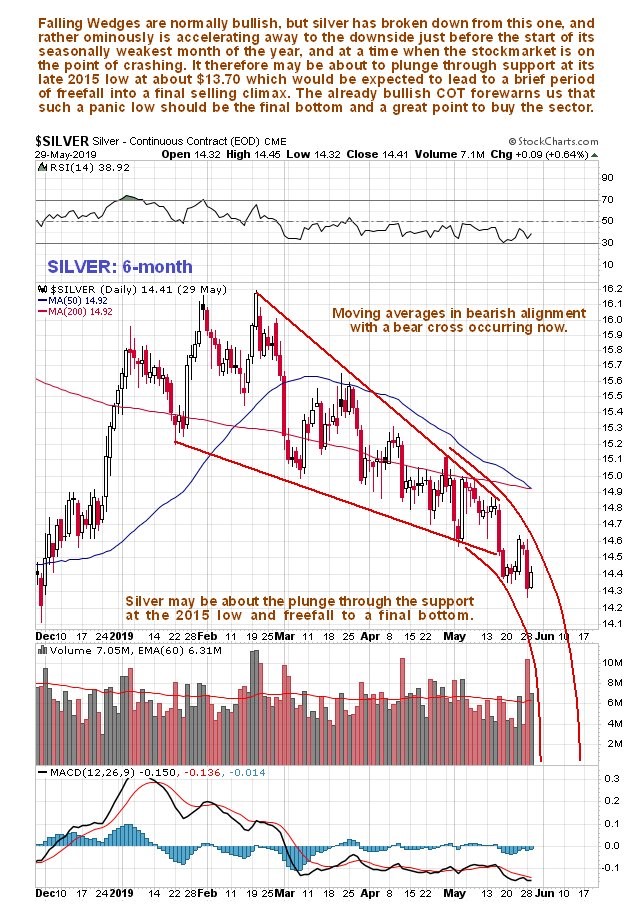
Silver Daily Chart
However, sometimes we have to RE-DRAW technical lines on charts to include newer trading patterns. While Clive Maund saw the present silver setup as negative or bearish, heading for a “Freefall” in his words, it turned out to be the exact opposite:

Silver Price Daily Chart
Not only did silver finally break above its falling wedge pattern, but it did so as the Dow Jones Index fell by 1,000 points. Thus, the ongoing rhetoric that the precious metals prices will decline along with the broader markets continues to be an incorrect forecast as gold and silver trade higher during large market sell-offs.
If we look more closely at the silver falling wedge breakout, we can clearly see how the price trades off technical support and resistance levels:
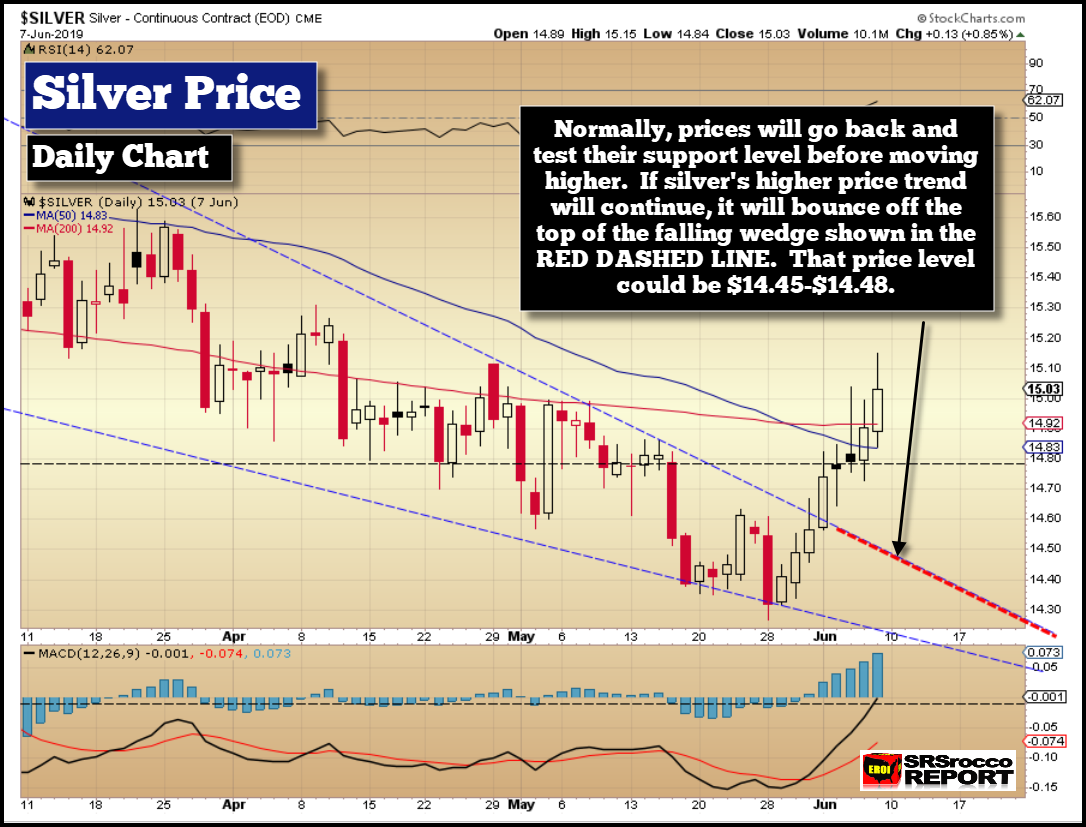
Silver Price Daily Chart
Once silver broke above the falling wedge (blue dashed lines) on June 3rd, we can see that it closed below the resistance level on June 4th (black dashed line). Now, the very next trading day on June 5th, silver shot above the resistance level but closed on at it before moving higher the next two days. Moreover, you can see that the silver price closed right below the RED 200 Day Moving Average the following day, and then touched the BLUE 50 Day Moving Average before going all the way up to a high of $15.15.
So, yes… TECHNICAL LEVELS do matter to traders and algorithms that control the price action in the market. Unfortunately, I can’t show a price candle for silver today because StockCharts.com doesn’t provide daily chart updates for precious metals, commodities, or energy until after the close of the day.
Now, the silver price doesn’t have to go back down to the top of the rising wedge, shown by the RED DASHED LINE, but in many cases, it will. Also, the silver price could continue lower to its long-term support level of $14. There is just no way of knowing, especially in these highly controlled markets by the central banks.
However, the fundamentals for the precious metals are much better than the broader markets as I have pointed out several times in the past. While these charts are from last week, we can see that the Dow Jones and NASDAQ are still quite overbought when we look at their 200 Month Moving Averages versus Gold and Silver:
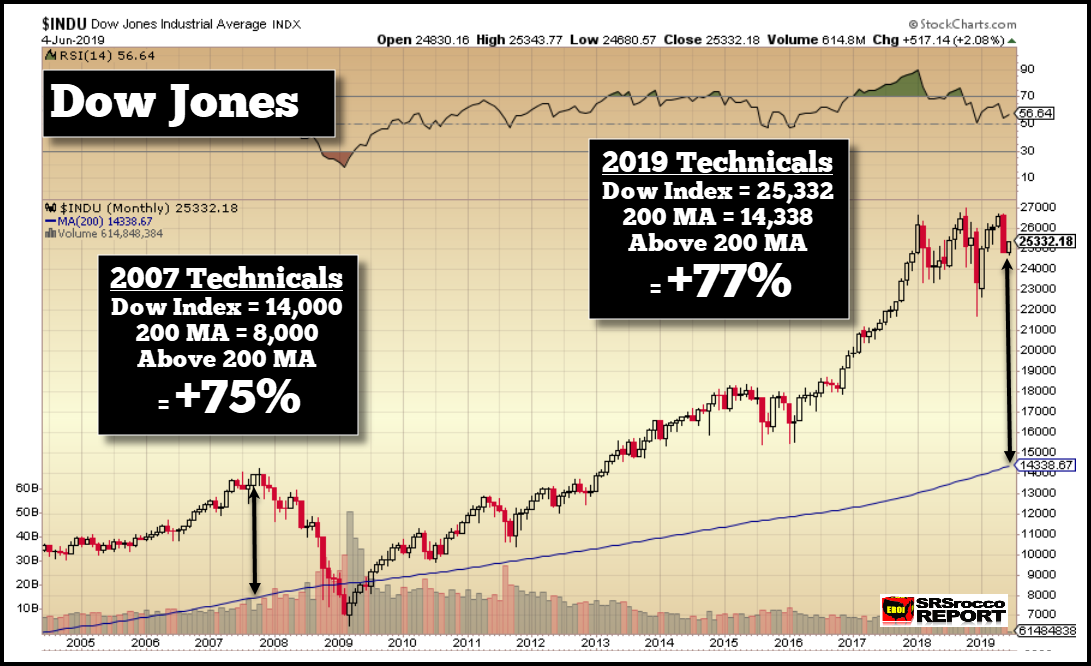
INDU Monthly Chart
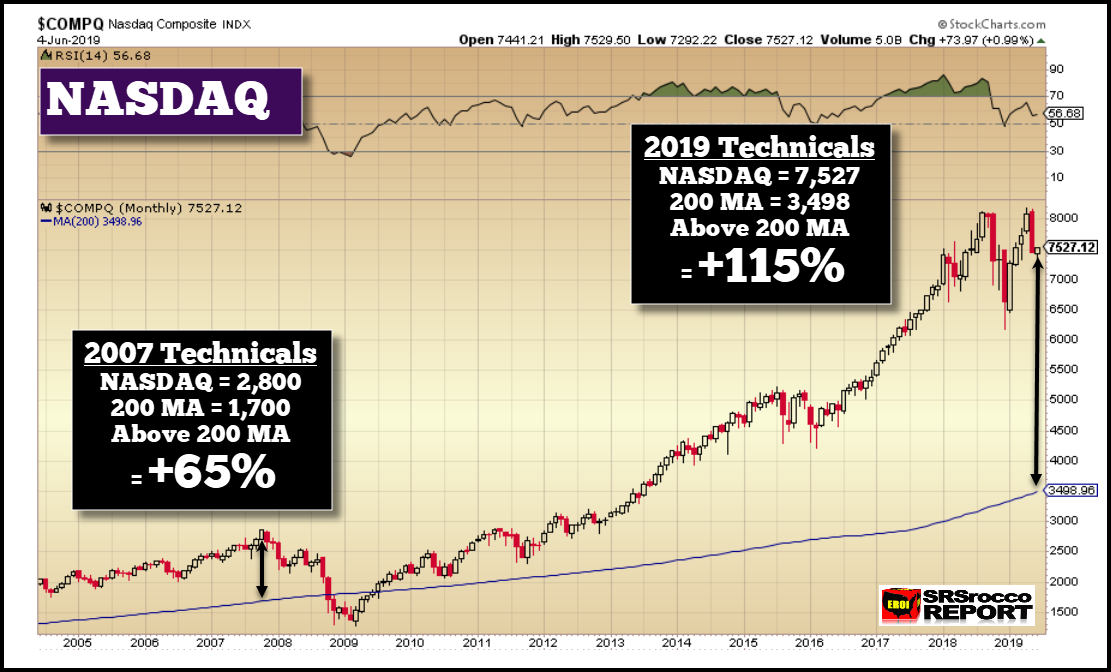
COMPQ Monthly Chart
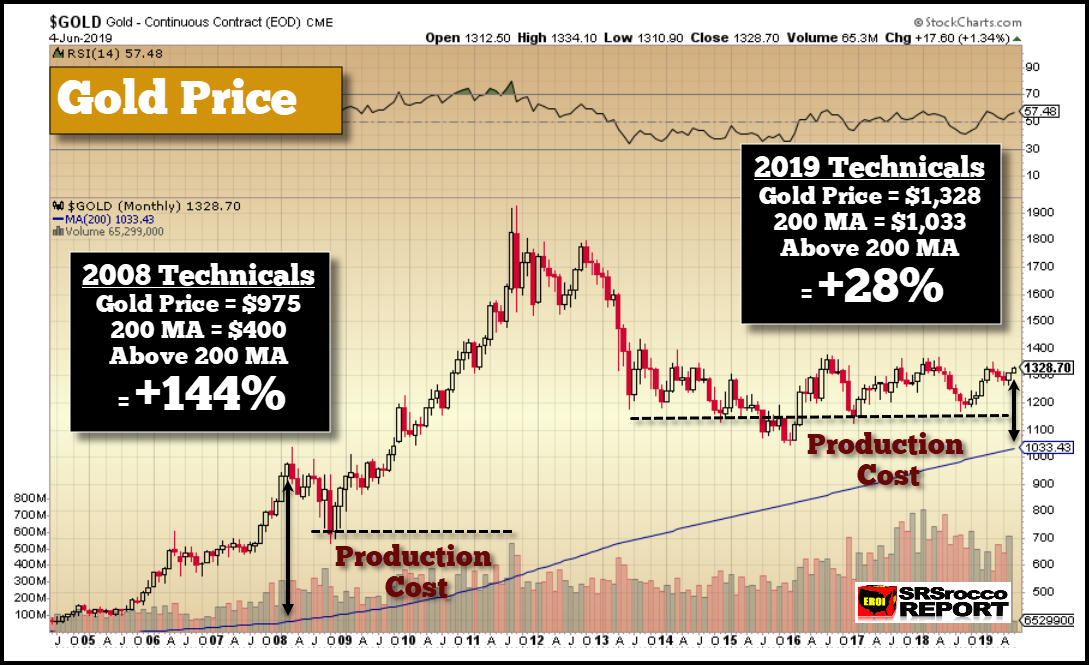
Gold Price Monthly Chart
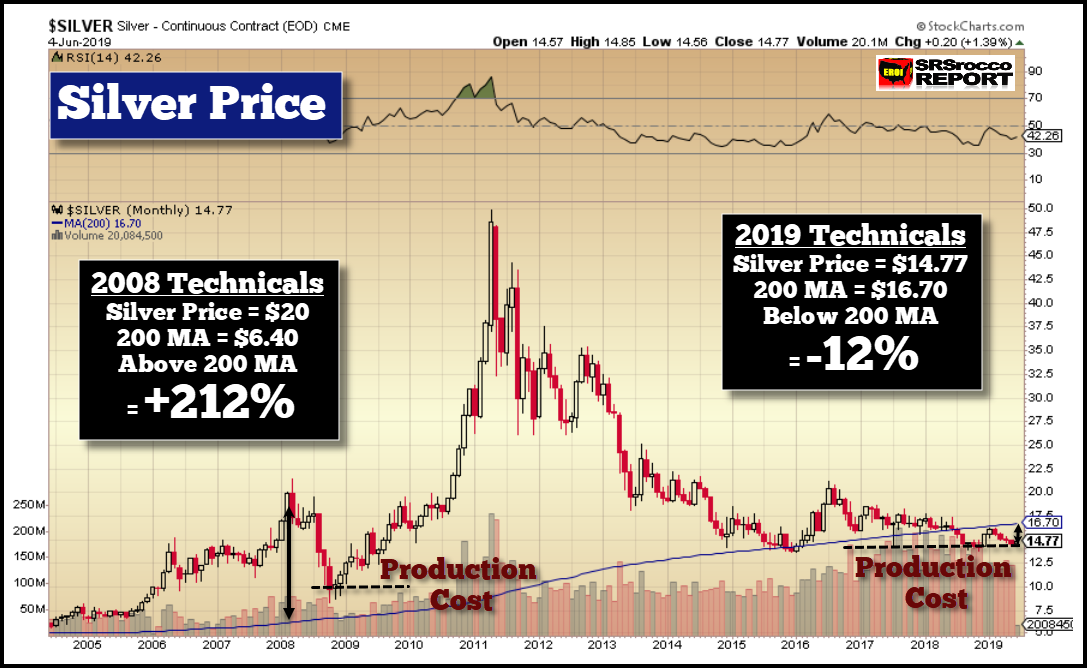
Silver Price Monthly Chart
While the Dow Jones and NASDAQ are trading well above their 200 Month Moving Averages, gold is much closer to its 200 MA, while silver is below it. Furthermore, you will notice the “Production Cost” trend lines I have put in for gold and silver during the 2008-2010 period and currently.
Again, the notion that gold and silver will crash along with the markets isn’t one that I believe will happen. And time and time again, we had seen both gold and silver shoot higher when the markets experienced large selloffs.
Lastly, in order for silver, “ON A TECHNICAL BASIS,” to continue higher, it will need to bounce off the top of the falling wedge line. It will be interesting to see the silver price action over the next week.
*********
More from Silver Phoenix 500


