Silver Projection From Crude Oil And T-Bonds


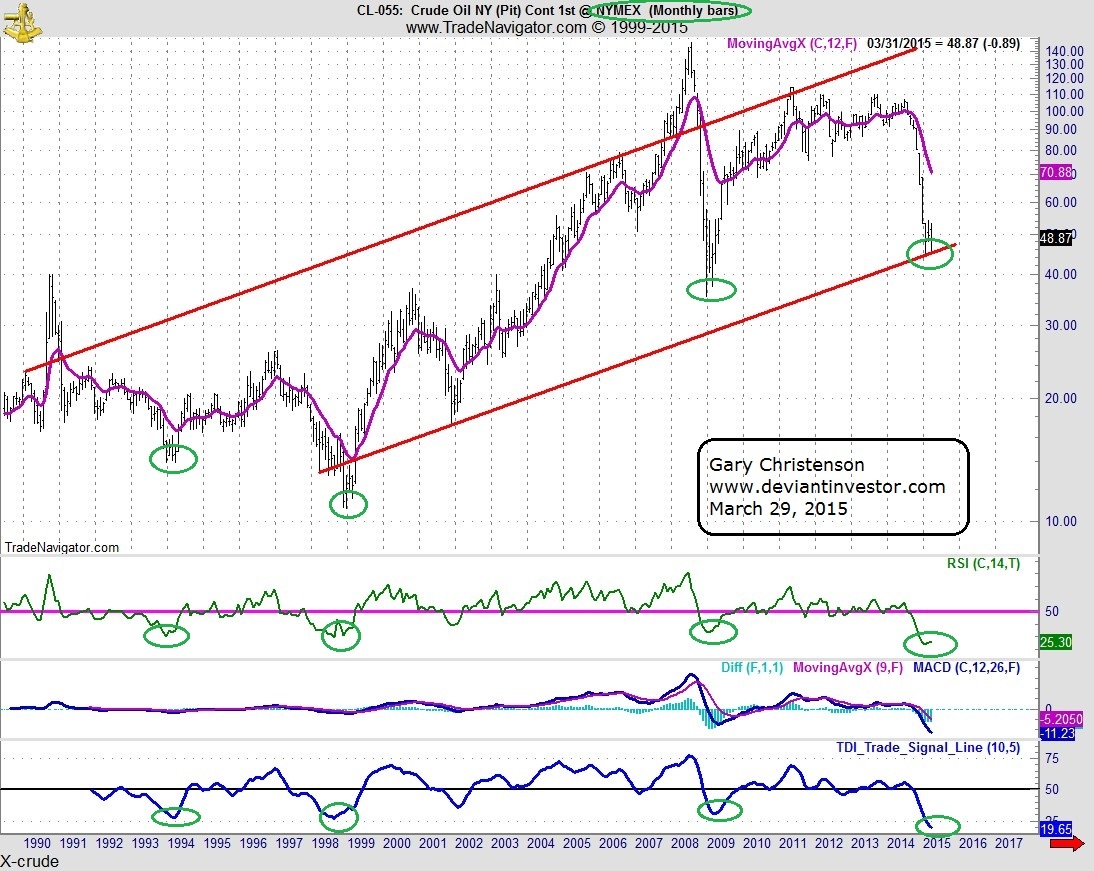
 Crude Oil is the world’s most important commodity as measured by dollar volume and wars fought to control it.
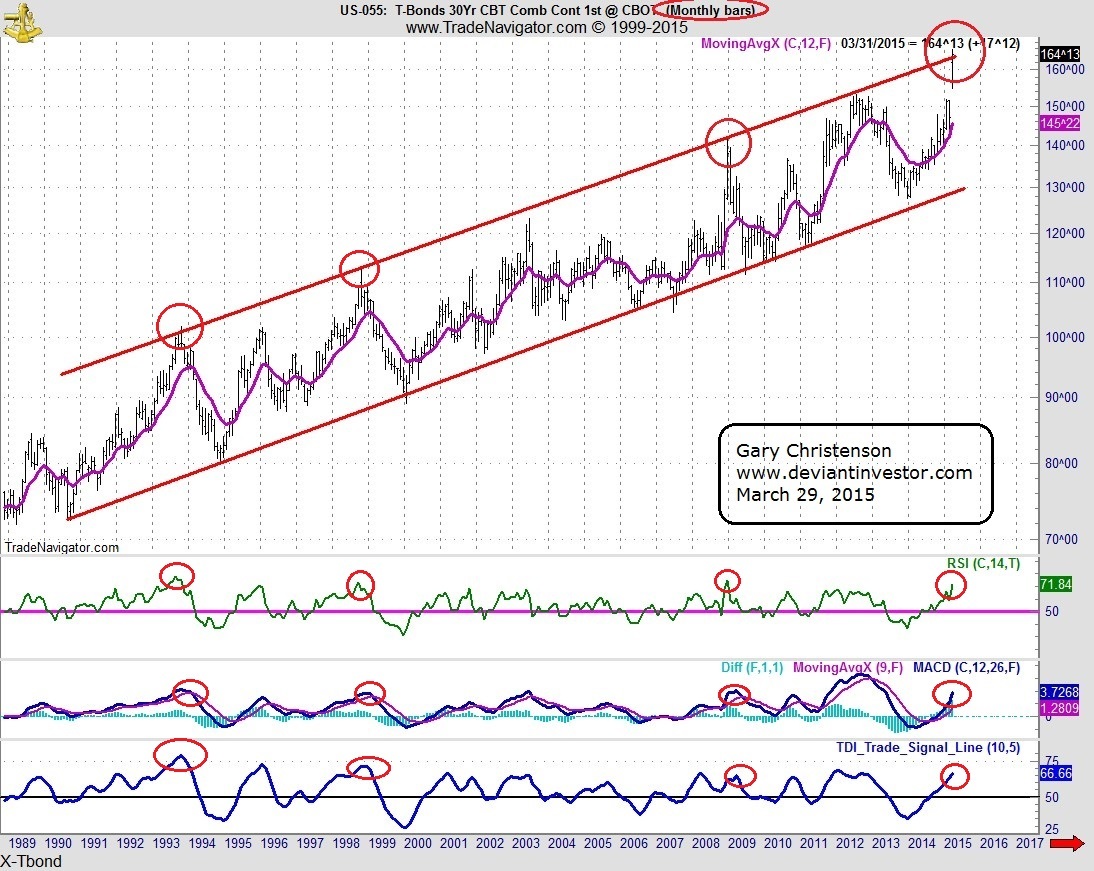
T-bonds are debt in the world’s reserve currency – the US dollar. The market is huge and important.
What do crude oil and T-bonds say about the silver market?
Examine the log scale graph of monthly crude oil and note the circled lows.
Examine the log scale graph of monthly T-bonds and note the circled highs.
Examine a graph of the ratio of Crude Oil to T-bonds since 1983 and note the circled lows.
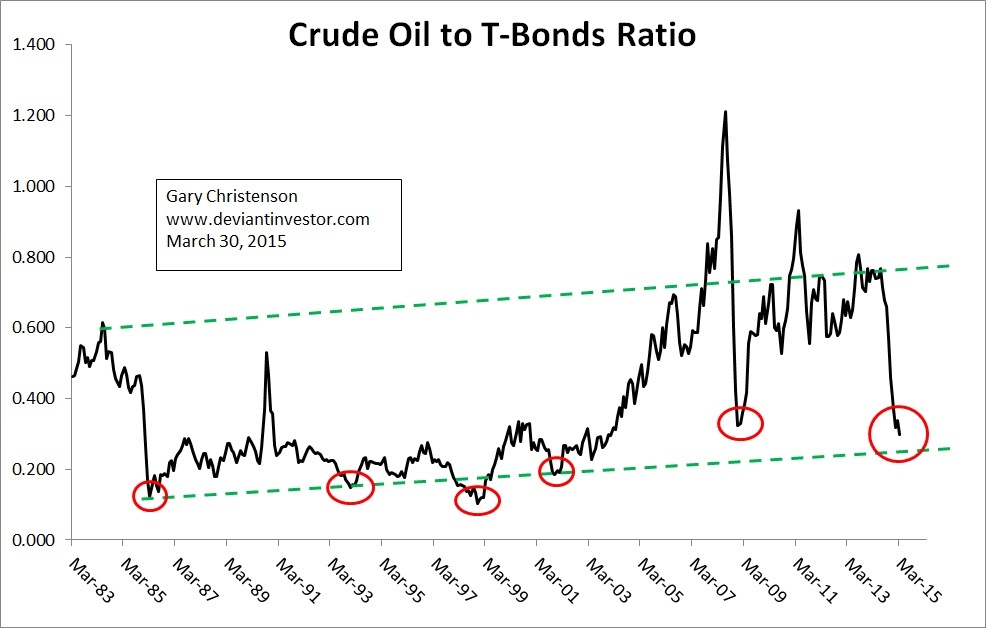
There have been 6 significant lows in this ratio in 30 years. They are important and marked with red circles on the graph.
Lows in Crude/Bonds Ratio Corresponding Silver Lows
Mar. 1986 May 1986
Dec. 1993 Feb. 1993
Nov. 1998 July 1997
Nov. 2001 Nov. 2001
Dec. 2008 Oct. 2008
Mar. 2015 Nov. 2014
Note the log scale graph of monthly silver since January 2000, the approximate beginning of the commodities bull market, the post 2000 NASDAQ crash era, and the military buildup post 9-11. I have marked the lows in the Crude Oil to T-bonds ratio with red lines and circles.
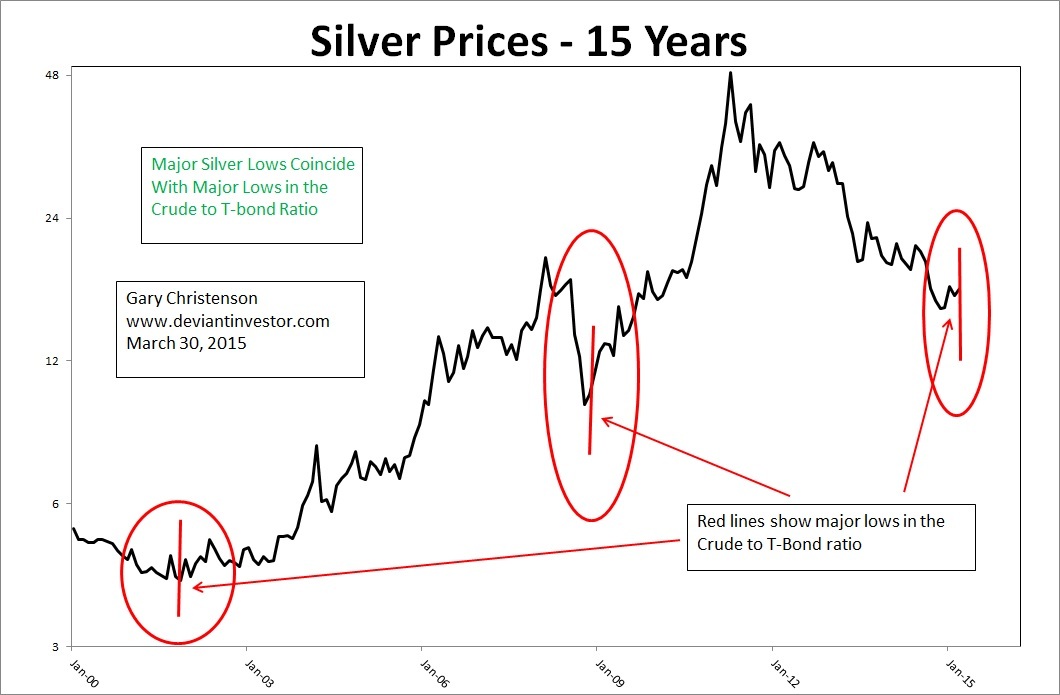
The bottoms in the ratio and the major silver market bottoms for the past 15 years coincide almost exactly. Why? Aside from central bank management and High-Frequency-Trading concerns, crude represents real commodities and T-bonds represent debt based fiat paper currency. In simple terms it is a conflict between real commodities and paper debt. Silver represents real value and a physical commodity so a bottom in the real/paper ratio (crude to T-bonds) is consistent with bottoms in silver.
Expectations For 2015 – 2016:
T-bonds made a 3 sigma move higher in March based on the monthly data through Friday March 27. The crude to T-bonds ratio hit an 11 year low. Lows for the last 20 years in that ratio have marked important lows in crude oil and also important lows in silver since 2000.
Maybe this time will be different, but I doubt it. Expect crude oil and silver to rally substantially in 2015 – 2016.
********
 Gary Christenson is the owner and writer for the popular and contrarian investment site Deviant Investor and the author of the book, “Gold Value and Gold Prices 1971 – 2021.” He is a retired accountant and business manager with 30 years of experience studying markets, investing, and trading. He writes about investing, gold, silver, the economy and central banking.
More from Silver Phoenix 500


