Is Silver Setting Up For A Breakout?


After gold broke above a critical resistance level, held for the past five years, precious metals’ investors are now wondering, “what’s in store for silver?” While gold surged from $1,340 to $1,440 in just one week last month, silver only went up a mere $o.70. Thus, the Gold-Silver ratio increased from 89/1 to 94/1, in the same five-day period.
So, the BIG QUESTION many precious metals investors are asking, “Is silver going to follow gold’s move higher?” And, in several price trends in the past, silver does follow gold higher but also outperforms the yellow metal in the later stage.
To understand the dynamics of the silver price, we must realize it is based upon two aspects of the market:
- Technical Analysis
- Fundamentals
While many in the precious metals community discount or don’t believe in technical analysis (I was guilty of this for years), the majority of traders, investors, hedge funds and institutions most certainly do. So, if we ignore these technical levels or formations, then we are also blind to how price discovery is being made in the market… yes, even with market intervention.
Now, I am not saying that the current price discovery of silver at $15.25, is based on sound fundamentals if we compare its real value as a store of wealth to all the DEBT, DERIVATIVES, and JUNK ASSETS held in the world, but rather, how it is being priced by the leading DRIVERS in the market… which are traders, investors, hedge funds and institutions.
To better understand how silver is being currently traded, you must know what these leading PRICE DRIVERS are looking at. Furthermore, many precious metals investors say that they don’t care about the short-term price movement or technical analysis, but when the silver price happens to fall to a low (or is underperforming gold or the market), then there is no shortage of BELLY-ACHING, and COMPLAINING by the very same people who supposedly ignore this information.
So, instead of watching Kitco for daily price actions, hoping and praying for the silver price to finally start moving significantly higher if we look at the technical analysis, it gives us some important clues. Again, I still believe the value of gold and silver will be some of the best assets to own when the over-leveraged financial system and economy crash, but if we pay attention to the technicals, they do indeed provide some hints, as they did when gold broke out above $1,360 in a big way.
For example, gold’s price BREAKOUT above $1,360 occurred in a technical formation called, an ASCENDING TRIANGLE. Here is my chart showing how gold’s price shot above that $1,360 level:
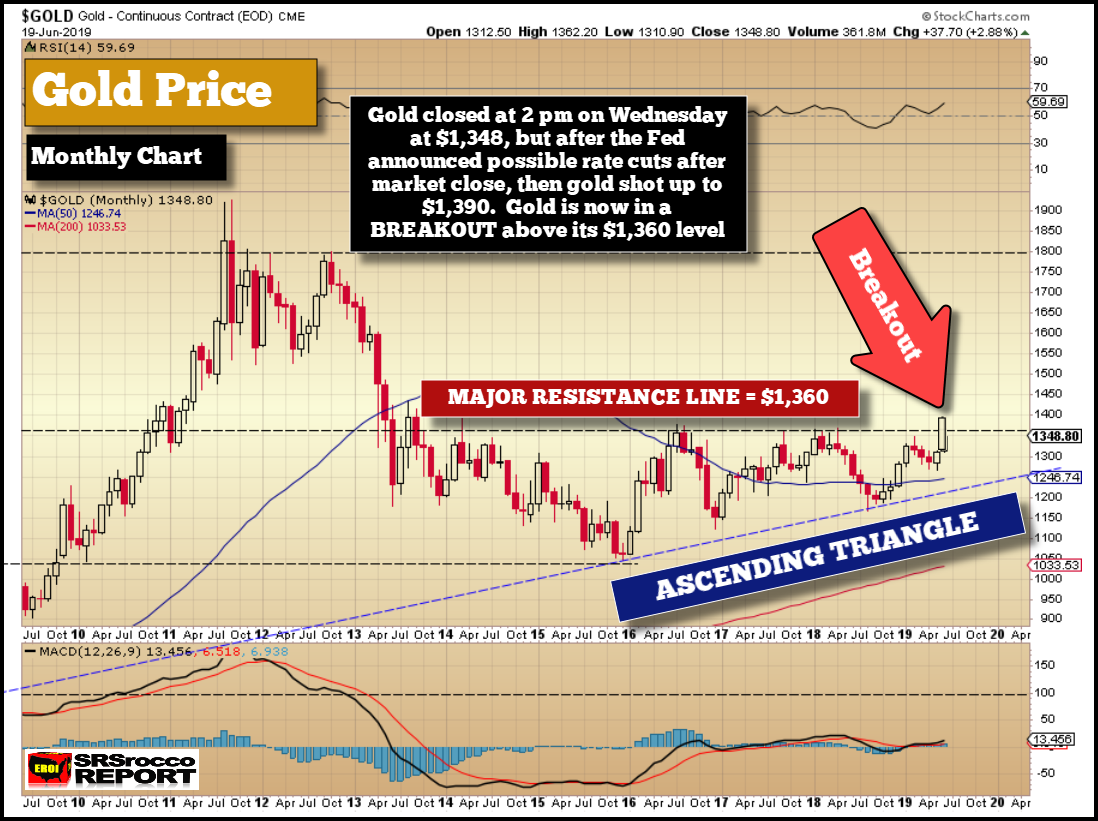
Gold Price Monthly Chart
According to technical analysis, a breakout above the Ascending Triangle Top Line is very bullish. Thus, traders, investors, hedge funds, and institutions use this information as a motivation to take confident positions in gold. Now, what are the silver price technicals saying??
Well, if we look at the 40-year monthly chart for silver, its price has been trading in a SYMMETRICAL TRIANGLE formation:
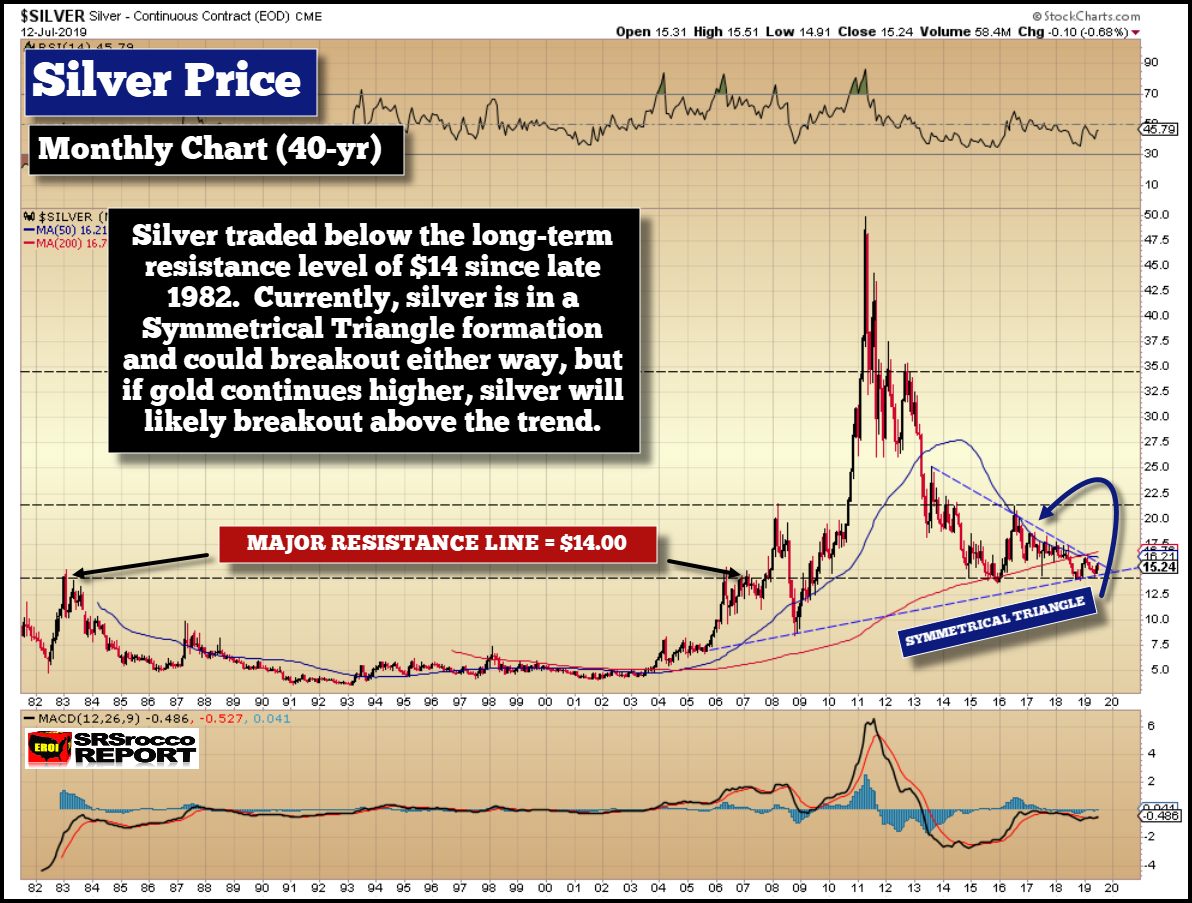
Silver Price Monthly Chart
The blue dashed lines show this Symmetrical Triangle formation. Furthermore, you will notice that when silver finally broke above the KEY $14 Resistance Level in 2007-2008, it shot up to $21 rather quickly. That $14 Resistance Level remained since 1983, but recently has acted as a MAJOR SUPPORT LEVEL. Now, if we take a look at a close up of this Symmetrical Triangle formation, you will see how tightly silver is trading in it:
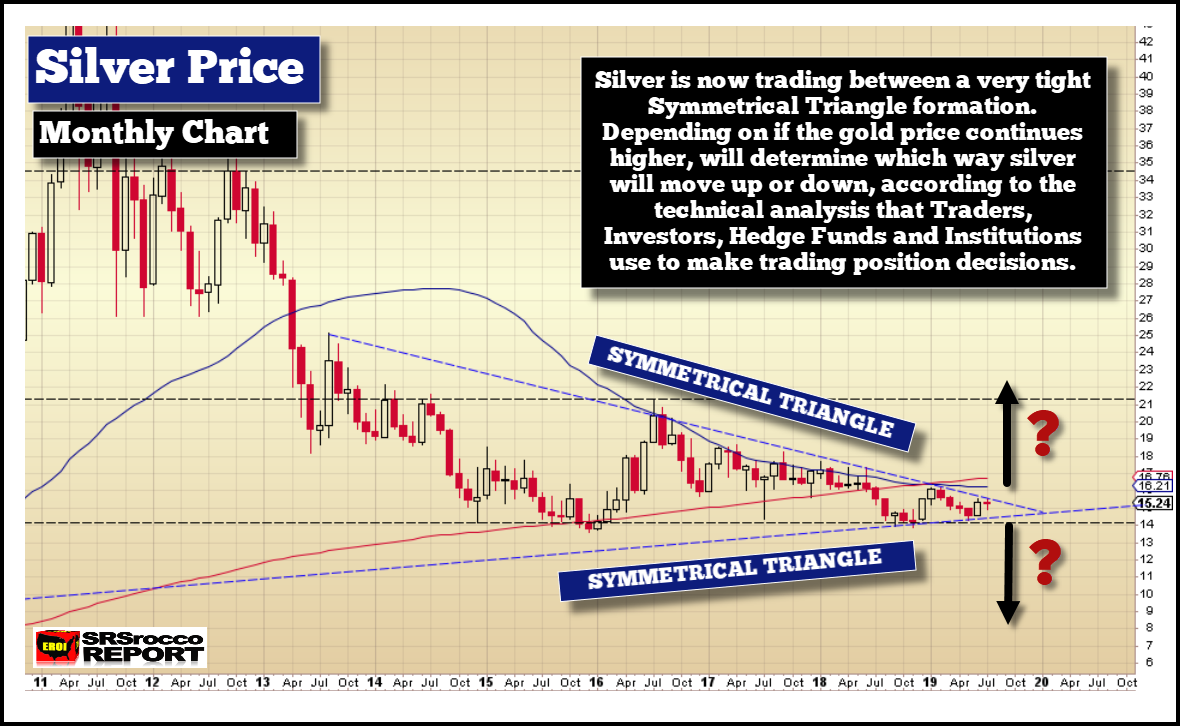
Silver Price Monthly Chart
There is no coincidence that silver is trading in-between this symmetrical triangle. However, a symmetrical triangle formation suggests a breakout will occur, but it doesn’t indicate whether that will be UP or DOWN. Thus, market drivers are keeping a CLOSE EYE on the silver price to see which way it will break out of this triangle formation.
I will be explaining this in much more detail in an upcoming video. Yes, I stated in the past that I would have already made a video, but I have been putting together the charts and will likely publish a new Youtube video in 10-14 days. Please stay tuned.
Major participants in the silver market have been following two important trend lines in silver over the past several years. The first one is the 50 Month Moving Average (50 MMA), and the second, is the rising bottom trend line:
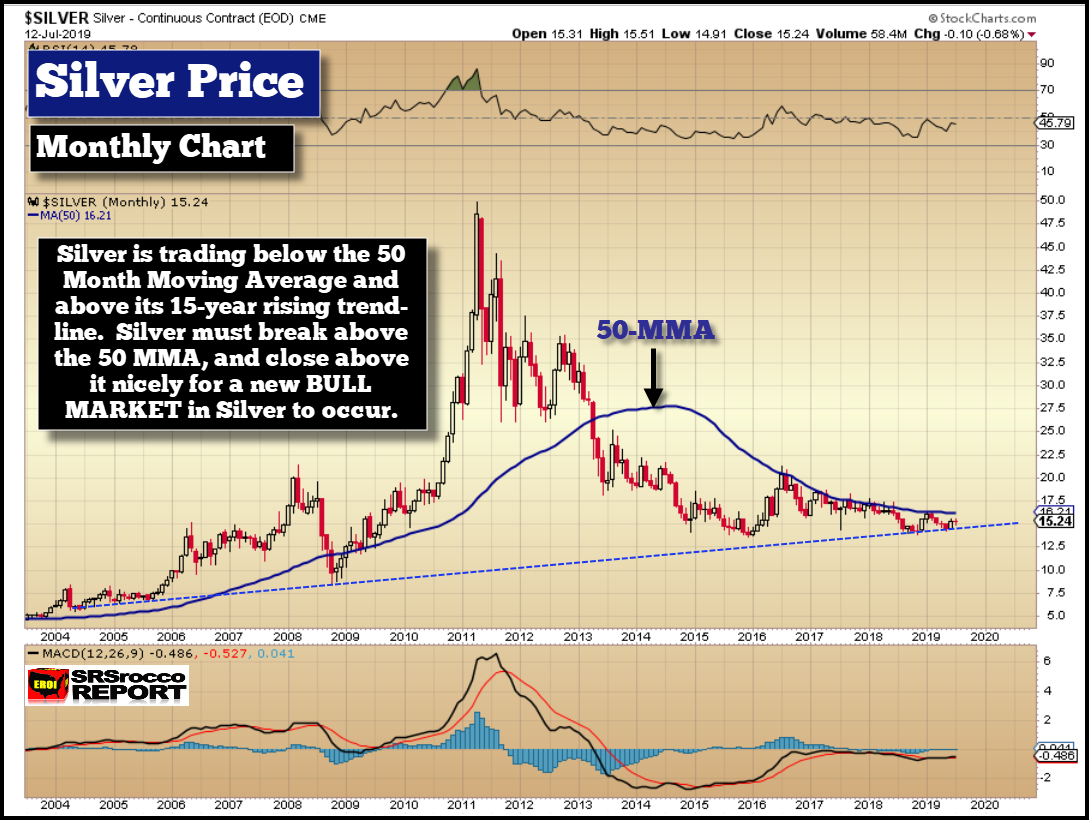
Silver Price Monthly Chart
Again, there is no coincidence that silver has been trading right up against the 50 Month Moving Average since the middle of 2016. Please take note that the rising bottom trendline is also the bottom part of the Symmetrical Triangle. Silver has not broken this lower trend line since 2004. Will it? Well, it could, but I doubt that it would do so for years because silver is now severely undervalued with respect to gold and most other assets.
Moreover, the direction to which silver initially BREAKS OUT of its symmetrical triangle may depend on the price direction of gold. So, if gold trends upward, even with corrections lower, than traders will likely believe silver will break-out ABOVE the symmetrical triangle formation that it has been stuck below since early 2013.
Of course, this information only provides short-term price movements that traders, investors, hedge funds, and institutions look at in determining the market price of silver. THIS HAS NOTHING TO DO WITH THE LONG-TERM EXCELLENT FUNDAMENTALS OF OWNING SILVER. But, to get to that point, we are going to see it show up in the technicals. Again, more of the details in my upcoming video.
Lastly, many believe that the silver price may go lower or underperform gold during the next recession or weakening economy. At first glance, this makes perfect sense because a lot of physical silver demand comes from the Industrial Sector. However, if we look at another long-term chart, the Gold-Silver ratio fell to its lowest when U.S. unemployment was close to its highs. When the Gold-Silver Ratio falls, then the silver price is outperforming gold, and the opposite is true when the Gold-Silver Ratio increases:
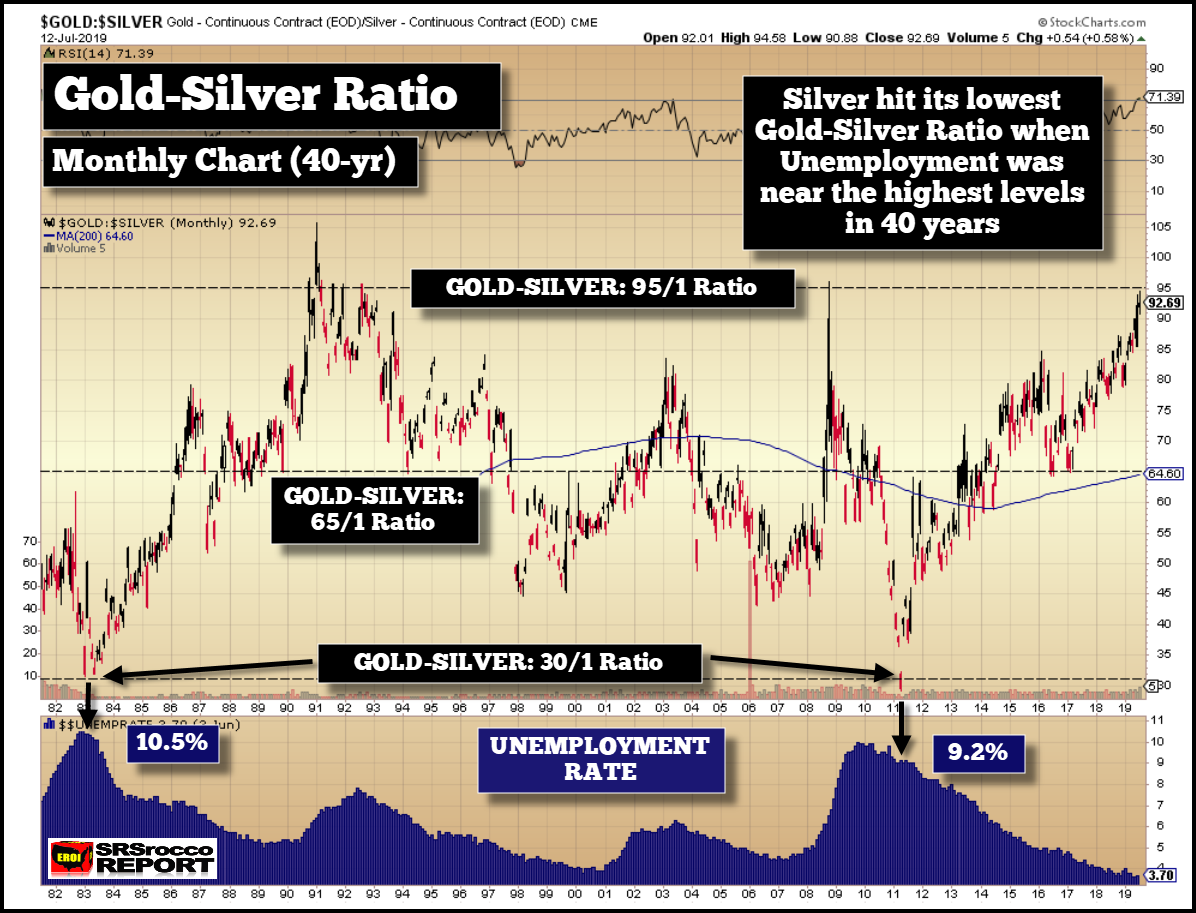
Gold Price Monthly Chart
The upper part of the chart shows the Gold-Silver Ratio while the bottom of the chart is displaying the U.S. unemployment rate, which is currently at 3.7%. Yes, the U.S. Government is manipulating the unemployment data. We all know that. But, if we just go by the data as an indicator, in 1983, when the employment data WASN’T MANIPULATED, the Gold-Silver Ratio fell to 30/1 when the unemployment rate reached 10.5%.
Furthermore, it wasn’t until the U.S. economy and markets collapsed after 2009, did the silver price shoot up to $50. So, when the U.S. unemployment rate was 9.2% in 2011, near the highs, the Gold-Silver Ratio fell below 30/1.
Here we can see that the silver price outperformed gold in a big way during two major recessions and elevated unemployment rates. Thus, the fear by precious metals investors that silver will do worse during the next recession may not be true and hasn’t been the case during the past two major recessions.
Also, you will notice that the Gold-Silver Ratio is hitting the upper level of 95/1. While it could go higher, the ratio always reversed lower back to the mid-level 65/1 Ratio, or even lower.
Right now, the Fed is fighting a market correction, and recession with continued Dovish statements since the Dow Jones Index suffered its worst Christmas Eve trading day ever. However, they haven’t GONE ALL IN YET with lowering interest rates and starting up QE (money printing). If they finally resort to doing this, we are going to see what happened to gold in June take place in a much BIGGER WAY in the precious metals. And, I would imagine silver will still outperform gold in the end.
*********
More from Silver Phoenix 500


