Silver In The Starting Blocks?


We gold and silver bulls have been grasping at everything that could shake the prices of the precious metals loose from the claws of the predatory Big Banks, pinning our hopes in turn and in combination on the Reddit Apes, increased deliveries from Comex and increased buying of silver from metal retailers. More recently, our hopes were also based on the implications of Basel lll. I believe that a more certain remedy could be in the process of being engineered on Comex itself – the proximate source of all our woes for so many years. The engineering is being performed by the Cabal itself; not to accommodate the silver bulls, but out of self-preservation.
This realisation was brought home to me by this week’s CoT report. It shows that up until Tuesday there was a significant net increase in the long positions in silver of the large and small specs, which amounted to 12 321 silver contracts. This enabled the commercials to reduce their net short position in silver by the same amount. So far, efforts to reduce the availability of silver and thereby effect a short squeeze have not had the desired result to relieve the selling pressure; in fact, the opposite happened. Also, the implications of Basel lll have not resulted in any of the anticipated changes in the behaviour of the banks.
Yet there can be little doubt that the Big Banks are fully aware of how precarious their silver short position is. I think the changes in the CoT report signal that the Big Banks themselves are looking for a way out of the potential silver short squeeze and they are setting up an ambush for the large specs into helping them reduce this risk. The data from the chart below support this conclusion. The chart shows a weekly bar chart of silver with 6 dates identified as A to F, which are summarised in the table.
The net open interest in the table corresponds to the narrow chart above at the times as indicated. Point A is located at the end of an extended well contained sideways drift in the price of silver during which the hedge funds algos could not find good direction and even went to net long in silver for a long time. Clearly, being only net short by
12 289 contracts, this would have been a really good time for the commercials to step away from their price suppression. Earlier, in September 2018, it would have been an even better time; then the commercials were net long by more than 8000 contracts.
They of course did not do so. At that time, with the silver price still well below $16.00, they clearly must have known they were in full control of the PM market and believed it would remain that way for another decade. However, when the price of silver began to climb and approach $18, the selling resumed and at point B the commercials were net short by 99 360 contracts – after having been above 100k for a short time – most at the six selected dates. Then the COVID panic of March 2020 came to their rescue; in less than a month the commercial net short position had almost halved to 54 647.
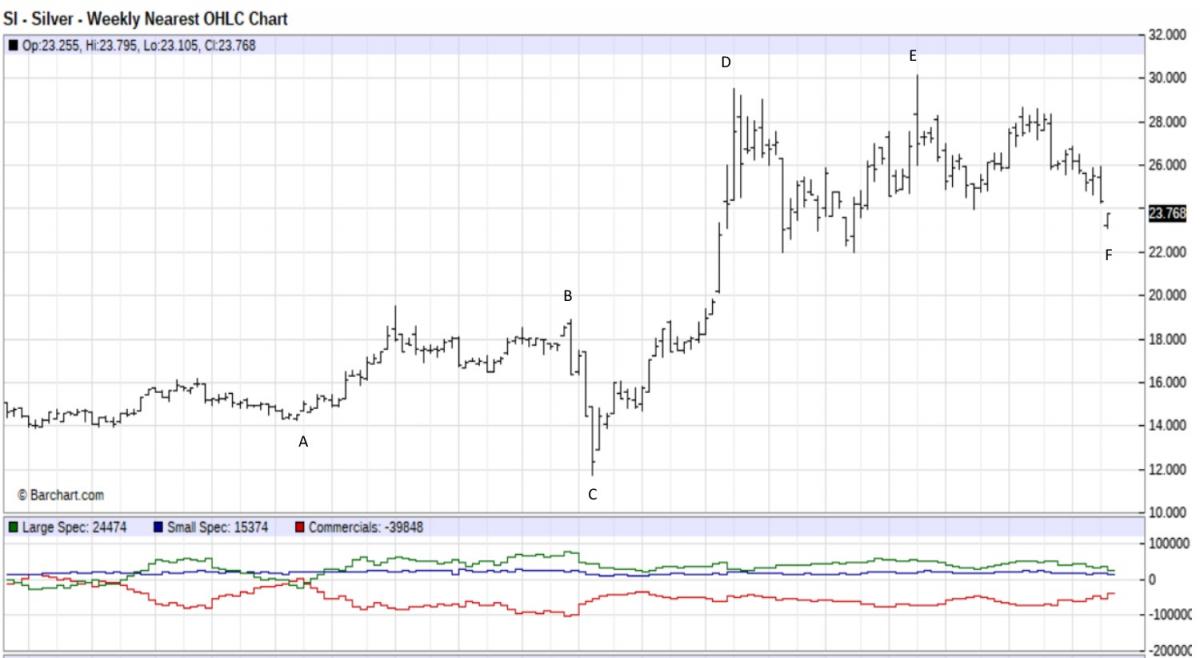
By early June, the price of silver had reached just short of $30, yet despite the rally the commercial net short OI had declined by about 3 500 since mid March. Clearly, they did not try to halt the rally until August, when the price dipped – probably being assisted by silver bulls who saw the return of selling by the Big Banks – and quickly took profit. When buyers later returned to Comex, with the price climbing back to the $30 level, increased selling again by the commercials increased their net short position to 71 854 as they again tried to stem the tide, doing this with reasonable success.
Since mid-June, when the last rally ended and until last week, silver was kept continuously under pressure, culminating in a sell off last week. The weekly bar chart shows a gap lower which, should the price open higher than $24.25 on Monday, would leave a gap island bottom reversal – a strong bullish signal. However, with commercials net short at 39 848 and large specs a week ago still net long by 24 474 contracts, much will depend on how the specs reacted to the even lower price of silver during the rest of the week until Friday.
How their short position was at the end of the week will determine whether the Banks decide to do some more selling to maintain the pressure. Perhaps the large and small specs have reduced their long positions to again go net short and leave the Cartel with a net long position and no longer subject to any short squeeze. Should the Cartel then release their pressure on the price of silver, they might still maintain it on gold, which is the monetary metal to protect the dollar. A short squeeze then will be on the large specs, who will not hesitate to buy at best to cover their shorts and thereby to launch a new leg of the silver bull market, leaving a full gap island bottom reversal in place.
Euro–Dollar
Euro–dollar, last = $1.1791 (www.investing.com)
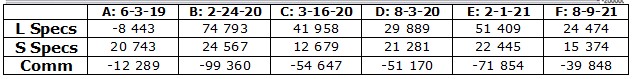
Recent strength in the US dollar had the euro in a slide from above channel XY to end last week at support of line X. The combination of this support and the slide lower along line G suggests that the dollar rally might be at or near its end, after the dollar index reached a high above 93 on Thursday. If a new euro rally is to begin this week, it also might coincide with a jump in the price of silver, as speculated earlier.
DJIA daily close
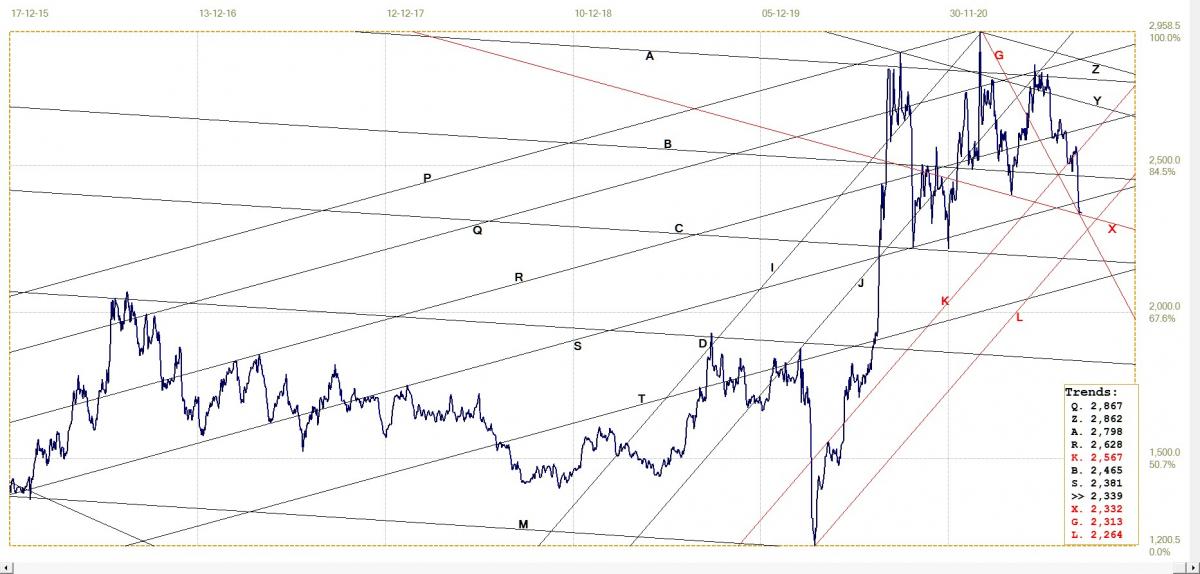
The DJIA spent all of last week sideways above the 35 500 level, achieving a new all time high 35 515 on Friday. The weekly close was only about 27 points short of the strong resistance along line B.
Observe that there has been only one period at the end of the initial phase of the bull market in September 2016, before the election, when the DJIA broke above line B to reach the top of bull channel AE. All the other attempts to break back into channel AB have failed, except for the tight double top in May this year. The first of the two tops happened in order to meet with line K for a second time and then the second, even smaller break above line B, to form the tight double top.
As these minor breaks show, the trend lines are not impenetrable, but the close on Friday so near the trend line could turn out to be a significant top in the bull market.
DJIA. last = 35515.38 (money.cnn.com)
Gold London PM fix – Dollars
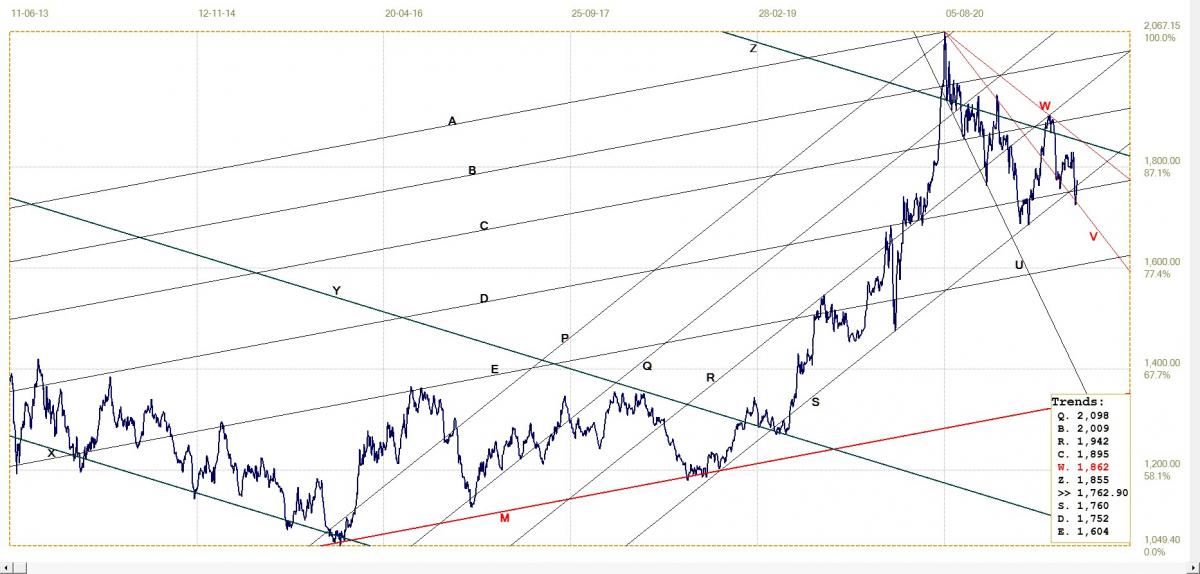
Gold price – London PM fix, last = $1773.85 (www.kitco.com)
Interestingly enough in light of the earlier discussion, the price of gold in terms of the London PM fix reversed higher from the low on Tuesday, while the silver fix continued lower to end the week at a major new low. The divergence between the two metals is not small – gold rebounding by $50 off Tuesday’s low fix, while silver reached a new low. Perhaps this divergence supports the contention in the discussion that the price of gold, given its role as a monetary metal, is to be suppressed to protect the dollar, while silver is to be left to find its own level without risk of a short squeeze.
Euro–gold PM fix
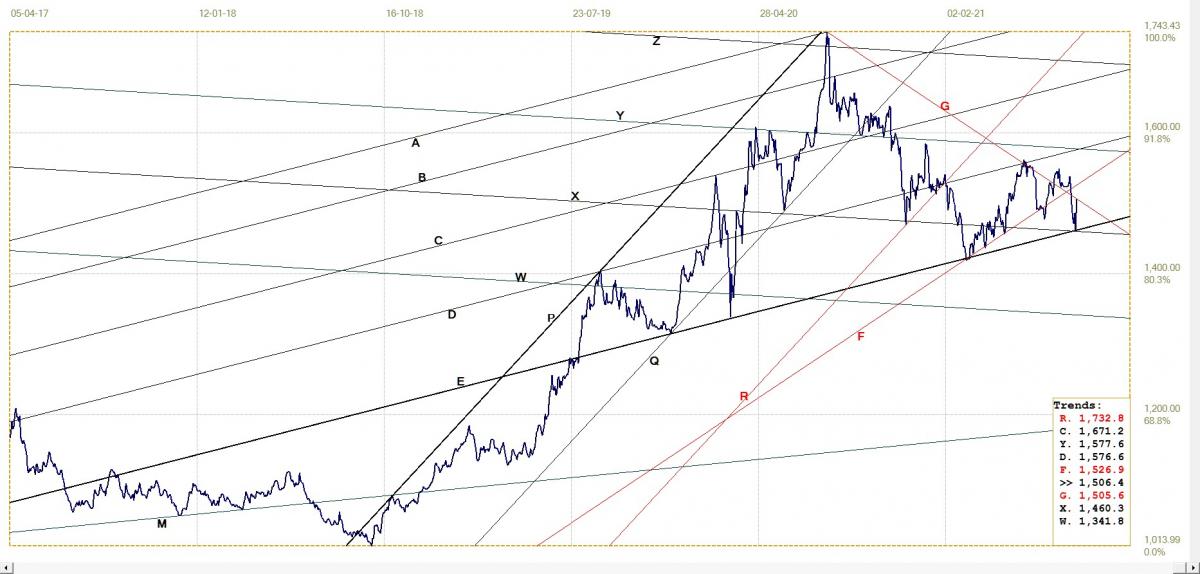
Euro gold price – PM fix in Euro. Last = €1506.35 (www.kitco.com)
The new low in the euro price of gold was reached on Thursday, followed by a sharp rebound. This again supports the method of channel analysis used in these examples to identify potential levels of support and resistance. The reversal off the cross-over of lines X and E confirms both these lines as important support.
With the likelihood of a stronger euro as per the first chart, a continuation of the new reversal higher off support, perhaps to break clear above line G, will require that the price of gold has to continue higher and extend the move of late last week. Whether this will be allowed, as speculated earlier, remains to be seen.
Silver Daily London Fix
The implications of the silver low fix at line X have been discussed. This week should reveal whether this low will continue to hold and further develop the gap island on the weekly chart, or whether the price will jump to leave a gap island behind. Whichever happens, it does look from the OI analysis as if the silver is now facing a bright future.

Silver daily London fix, last = $24.975 (www.kitco.com)
U.S. 10–year Treasury Note
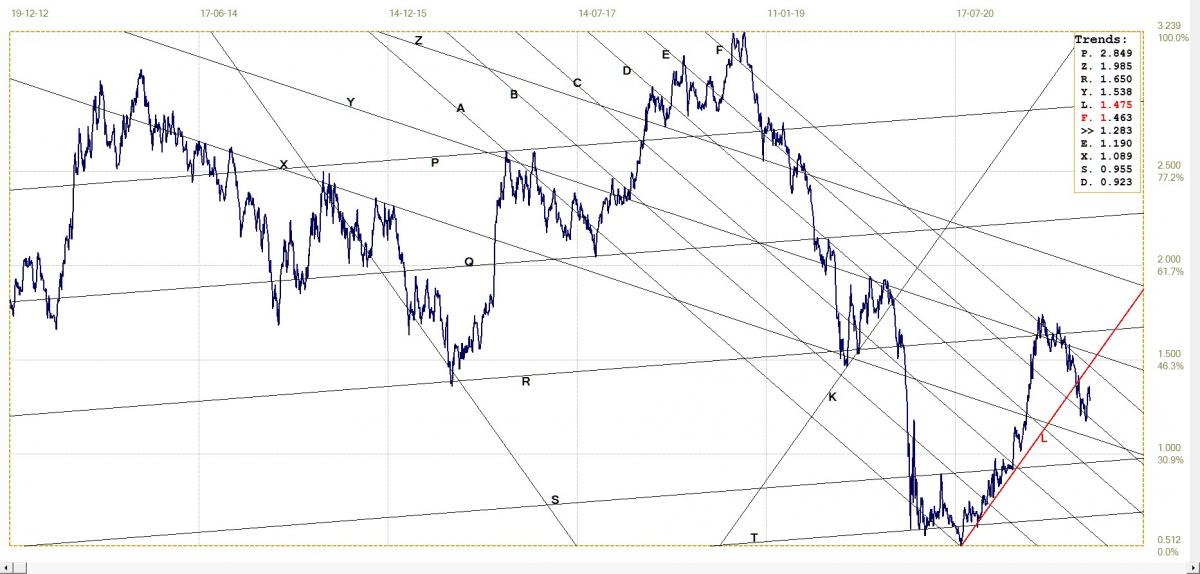
U.S. 10–year Treasury note, last = 1.283% (www.investing.com )
The trend towards lower yields on the 10-year US Treasury note has now ended, with the yield moving higher from near line E and approaching the bottom of channel KL. A break back into the channel could turn out to be technical confirmation of perceptions starting to accept higher inflation of longer duration. The anticipated issues of longer term Treasuries as infrastructure spending picks up during a period of higher inflation should then see the yield rising to again challenge trend lines Y and R and perhaps break even higher.
West Texas Intermediate crude. Daily close
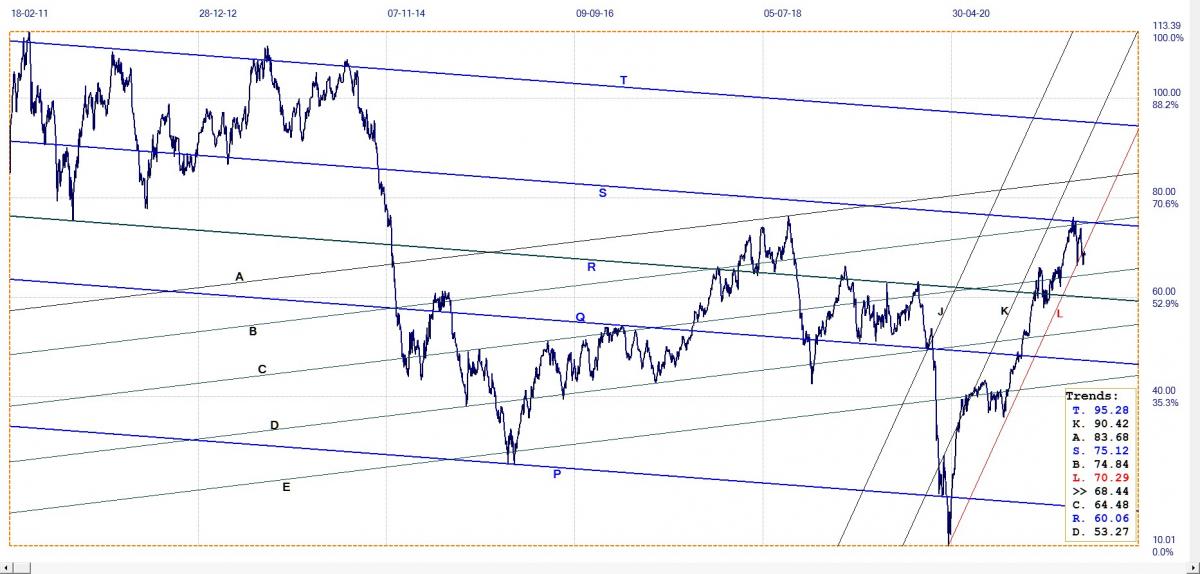
WTI crude – Daily close, last = $68.44 (www.investing.com )
The price of crude has finally broken below the steep and quite narrow bull channel KL to hint at a slowdown in the rising price and perhaps a reversal to a lower price. The possibilities are a sideways trend between the lines S and C or perhaps a break lower from this range, to below line C or even line R. A slowdown in the rising trend should relieve the pressure on higher inflation, but could also be a symptom that warns of a slower economy or even the stagnation that gives rise to the term ‘stagflation’.
While the price of crude remains bullish, to be confirmed with a break above lines B and S in the not too distant future, higher inflation is on the cards. A definite break below channel KL and new lower trend is, however, unlikely for the near to medium future given the official emphasis on containment of global warming and reduced access to and presumably reliance on fossil fuel.
********
More from Silver Phoenix 500


