Silver Use in India Solar Projects Is Skyrocketing


The rapidly growing middle class in India has led to massive new energy demand, and the populous nation is increasingly turning to solar.
A boom in solar projects worldwide is gobbling up substantially more silver ounces every year, adding to the annual silver production deficit reported in recent years.
India's electricity generation grew by 8% in 2023 and solar accounted for 20% of that growth.
India added 12GW of solar in 2023, but the growth rate would need to be 4x higher just to cause coal power to flat-line in absolute terms.
12GW x 4x Higher = 48GW (500,000) = 24 million ounces of silver
This matters for energy transition as India derives 75% of its grid from coal, which is even more than China's 60%, and rising rapidly.
The utilization rate of India's coal fired plants increased from 53% in 2019 to 68% in 2023, which may also augur for building more coal plants?
Levelized costs of partial electricity are estimated at 4-6 c/kWh for unabated coal and 5-8 c/kWh for utility-scale solar, both at 10% hurdles.
India: electricity demand and power grid over time
India’s electricity demand is growing by 6-8% per year (+100-140 TWH per annum). But 75% of India’s power still comes from coal, which has itself grown at a 5% CAGR over the past half-decade, and by +9% YoY in 2023. Wind and solar would need to grow 4x faster than 2023 levels for thermal generation to flatline.
What does India electricity demand data mean for global energy markets?
India is now the largest country in the world by population, with 1.4bn people (18% of the global total), $3.5 trn of GDP, and GDP per capita of $2,500 pp pa. However, India only uses 6% of total global energy, 6% of total global electricity and emits 6% of global CO2.
What implications for energy markets and energy transition as India grows? And could India’s energy demand move global energy markets in the late 2020s as China’s moved global energy markets in the mid-2000s?
This data-file has tabulated, cleaned and estimated India’s electricity demand data, and power grid capacity data, monthly, by generation source, back to 2015, using data from India’s Ministry of Power.
Emerging world countries are going to prioritize energy security over energy shortages, as discussed in our outlook for 2024. And the data from India seem to support this conclusion, strengthening the conclusions published in the original note.
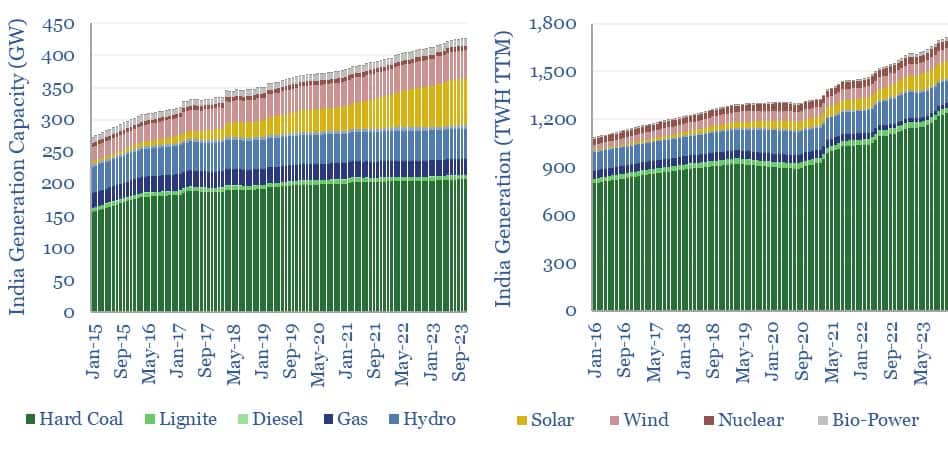
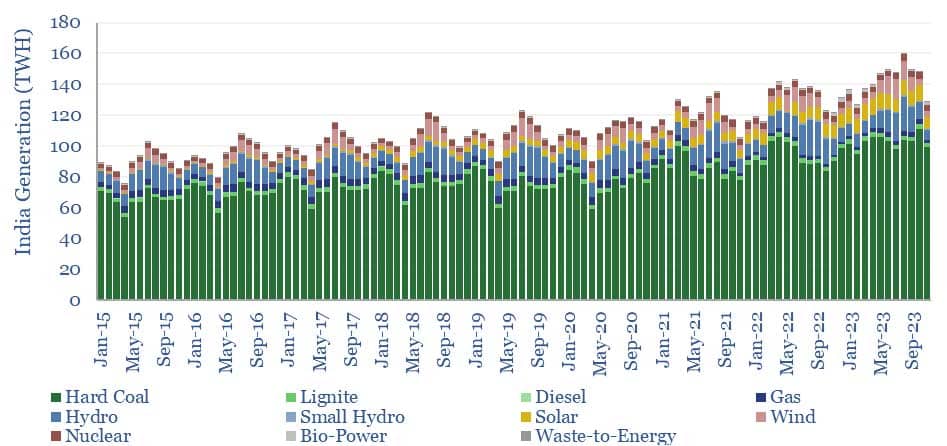
Electricity consumption in India grew by 8% in 2023, rising +120 TWH YoY, to surpass 1,700 TWH. The growth rate exceeded its trailing 5-year rate of +6% pa, but slowed from 2021-22 levels (chart below).
75% of India’s total power generation comes from combusting coal, which is even higher than China’s 60% share for coal in China’s power mix. Coal-fired power generation in India grew by 9% YoY in 2023, exceeding a trailing 5-year growth rate of 5% per annum (chart below).
Russia’s invasion of Ukraine has not helped, as Europe’s sudden thirst for LNG has pulled gas away from emerging world geographies. India’s total gas-fired power generation in 2023 was 40% lower than in 2019, which has required ramping up coal instead.
India’s total power grid has grown by 15GW per annum over the past half decade, of which 10 GW pa has been from solar (at an average availability factor below 20%), while 3GW pa has been from coal (at an average availability factor of 60%). This implies that new capacity additions have added solar and coal-fired electricity in equal proportions.
But the shift to coal is higher, as the utilization rates of coal plants also stepped up from 53% in 2019 to 68% in 2023. Thus coal fired generation has grown at a 1.5% pa CAGR over the past five years.
If anything, high utilization rates at existing coal plants may augur for a step-up in construction for coal-fired generators, per our coal outlook. Mathematically, wind and solar would need to be growing 4x faster than in 2023 to have kept total thermal generation flat.
Another opportunity to improve CO2 credentials in India’s power grid would be strengthening the efficiency of transmission and distribution, where losses are estimated as high as 20% of electricity that is generated, or 3x higher than in the developed world.
Some of this is due to climate, as power losses are amplified in hot and wet conditions, as covered in our overview of power transmission.
A final stand-out feature of India’s power grid is extreme seasonality. Hydro availability is 20% in the dry season (December-January) but exceeds 50% after the monsoon season (August-September). Wind’s availability profile is similar (chart below). While the call on thermal generation is highest in December-January.
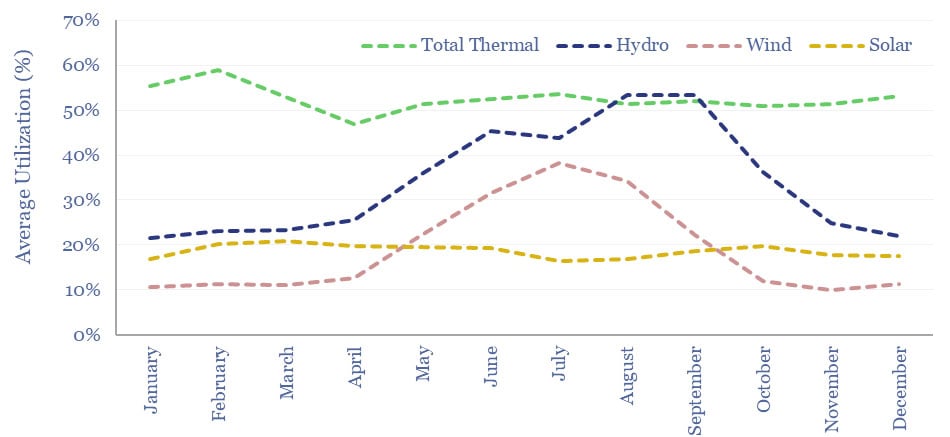
Wind and solar availability also vary +/- 3-6% each year, hence demand for backups, as per broader energy markets, will be volatile.
*********
More from Silver Phoenix 500


