Silver's Bull Market Has Officially Begun


Silver has officially broken out in a big way, kicking off its bull market. Multiple confirmations I was watching for have now been fulfilled, and silver still has plenty of fuel left in the tank.
While gold soared over the past year, silver lagged behind, repeatedly held back by two major resistance zones — $32 to $33 and $34 to $35 — which stopped multiple breakout attempts and kept it in a prolonged consolidation phase.
That finally changed a month ago when silver decisively broke through these critical levels. Although it paused in recent weeks, this was simply a healthy consolidation before the next big surge.
This past Friday, that surge finally arrived, marking a true breakout and the official start of silver’s bull market. In this update, I’ll discuss where silver stands now and share what I expect to happen next.
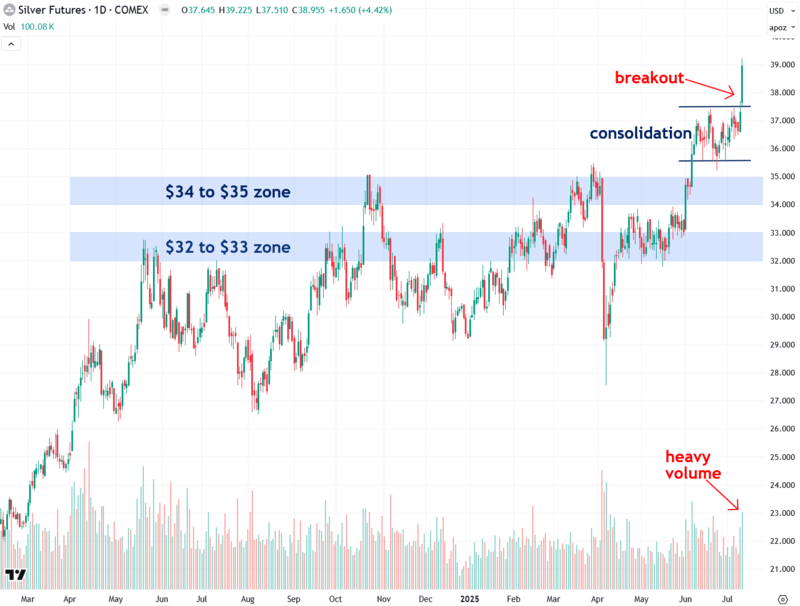
The chart below shows COMEX silver futures, which I follow closely because they tend to respect key $1 increments, often creating clear support and resistance levels.
Over the past month, silver has finally broken through the heavy resistance cluster between $32 and $35, a major technical victory underscored by Friday’s powerful 4.42% surge on strong volume that pushed prices right to the doorstep of $39 an ounce.
This is a highly positive development signaling that silver’s bull market is just getting underway. With this strong momentum, silver is likely to make a rapid run at $40 next — and then $50 soon after.
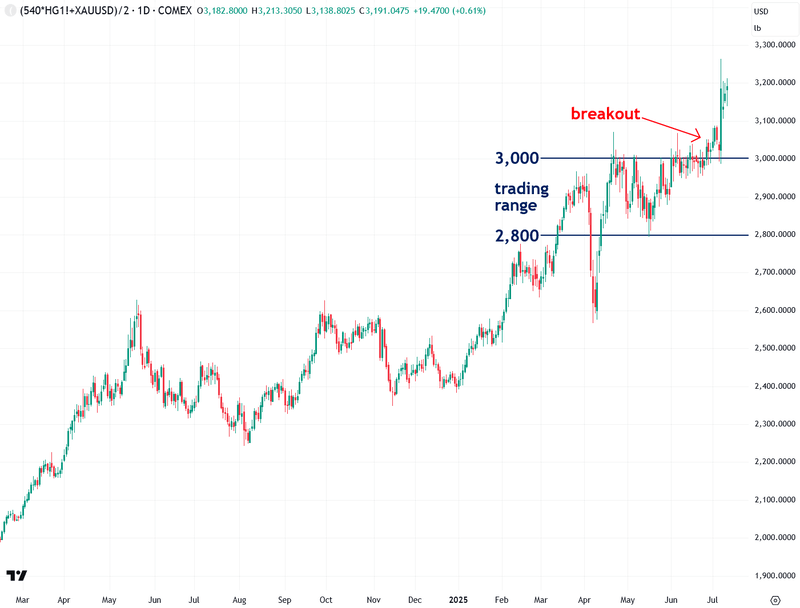
I’ve also developed a proprietary indicator called the Synthetic Silver Price Index (SSPI), designed to help validate silver’s price action and filter out potential false breakouts.
The SSPI is calculated as the average of gold and copper prices, with copper scaled by a factor of 540 to prevent gold from dominating the index. Interestingly, even though silver isn’t part of the calculation, the SSPI closely tracks its movements.
The SSPI finally broke out of its 2,800–3,000 trading range over the past couple of weeks, after being stuck there since March — a promising sign that foreshadowed the silver breakout I had been anticipating. Copper’s surge and breakout on Tuesday gave the SSPI a major boost and likely played a key role in silver’s move on Friday, as strong performances in both gold and copper often put pressure on arbitrage algorithms to buy silver in sympathy.
This breakout in the SSPI was one of the crucial confirmations I had been waiting for, along with a breakout in silver priced in euros.
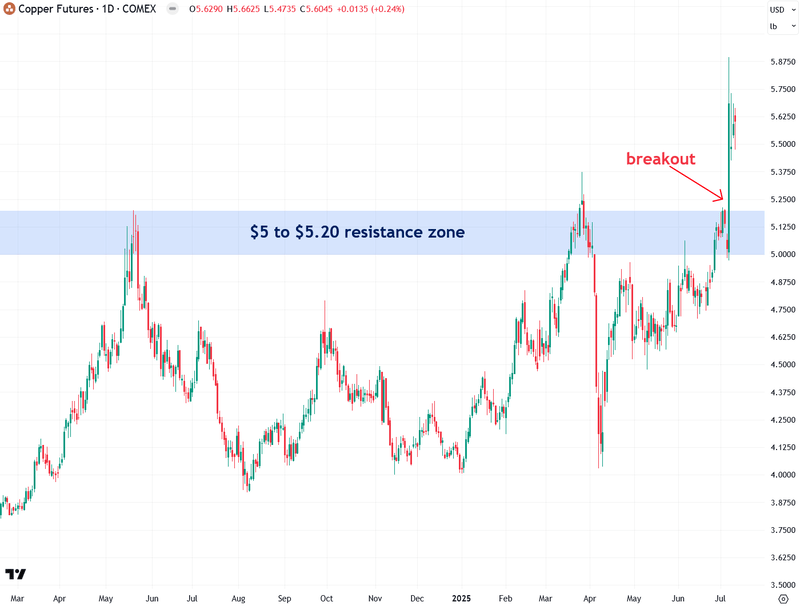
As the copper futures chart below shows, copper has finally broken above the $5 to $5.20 resistance zone that had held firm for several years.
This decisive breakout confirms that copper is now officially in a bull market of its own, and this new bull market should also serve as a strong tailwind for silver.
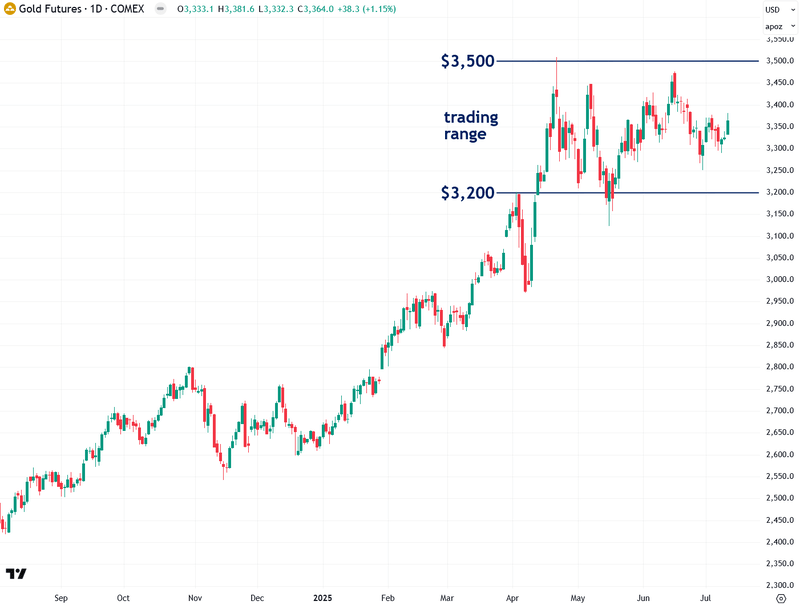
Although gold has been relatively quiet since mid-April, it has simply been undergoing a healthy consolidation between the $3,200 support and $3,500 resistance levels, working off its overbought condition after strong gains earlier in the spring.
This pattern is very similar to last summer’s consolidation, which was followed by a sharp rally once fall began and trading volume returned.
I’m now closely watching for a breakout above the $3,500 resistance, which would signal that gold is ready to resume its bull market. Such a breakout would also give silver an additional boost.
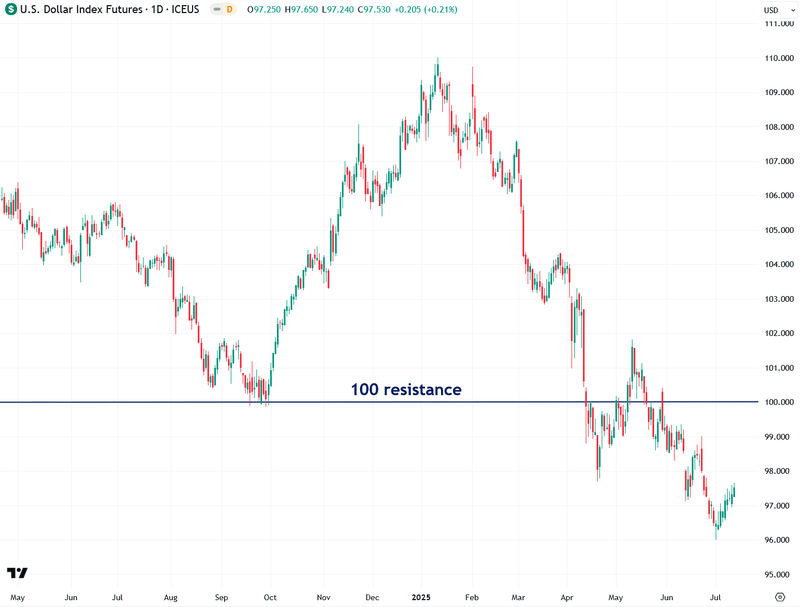
One factor fueling silver’s bull market is the weakening U.S. dollar, which recently broke below the key 100 level on the U.S. Dollar Index — a major technical breakdown. This breakdown indicates further weakness ahead, which is bullish for commodities — including precious metals — given their long-standing inverse relationship with the dollar.
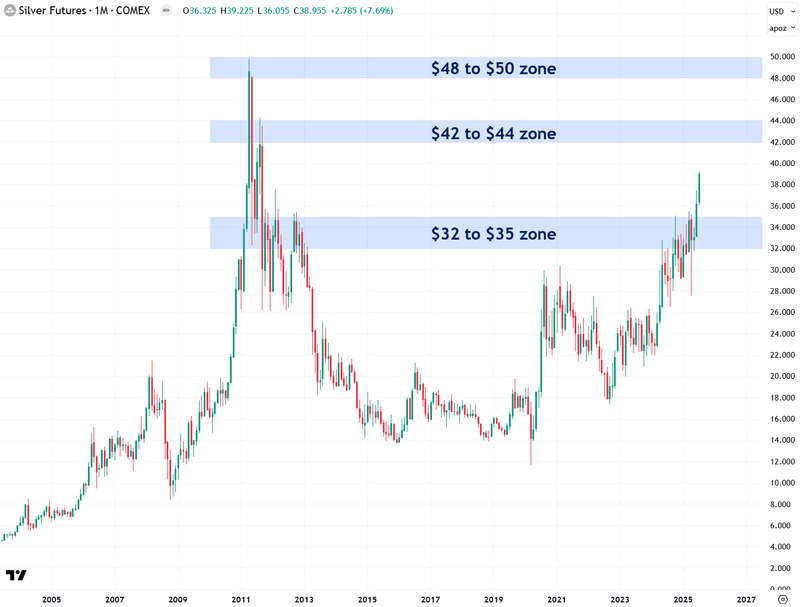
Now let’s take a look at silver’s long-term monthly chart to identify past resistance clusters that are likely to serve as price targets during this new bull run. These resistance zones were formed during periods of price congestion, most notably during silver’s surge and peak in 2011 and 2012.
The two most prominent levels that stand out to me are the $42–$44 zone and, ultimately, the $48–$50 zone. There is a strong probability that silver will aim for the most obvious target — $50 — during this rally.
And while it will likely pause to consolidate once it gets there, there’s no reason it has to stop at that level.
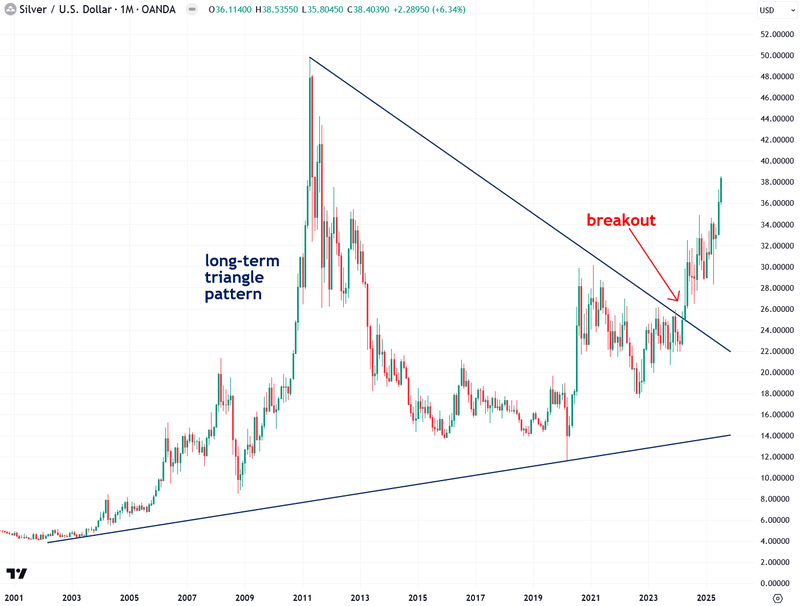
What first signaled to me back in April 2024 that silver was on the verge of a powerful bull market was its breakout from a two-decade-long triangle pattern:
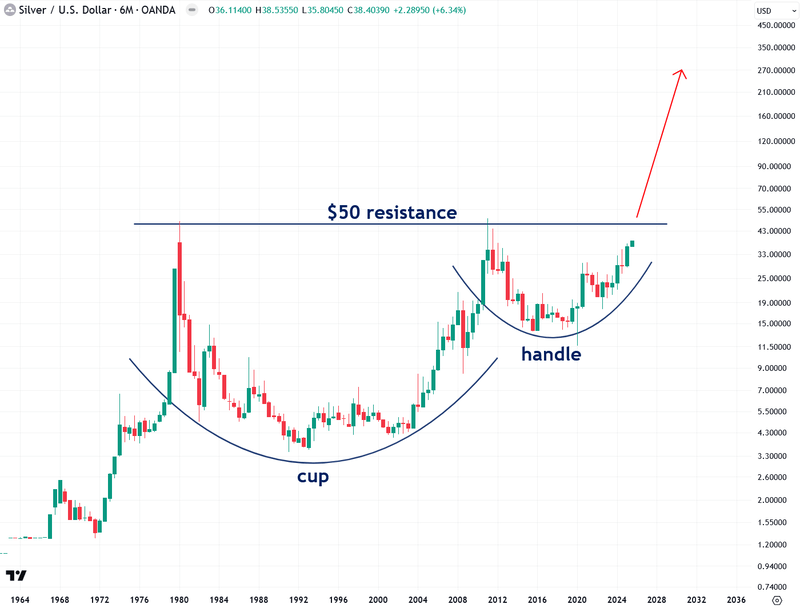
Even more exciting is the fact that silver’s logarithmic chart, dating back to the 1960s, reveals a cup-and-handle pattern, indicating the potential for silver to reach several hundred dollars per ounce during this bull market.
In order to confirm this particular scenario, silver needs to close decisively above the $50 resistance level.
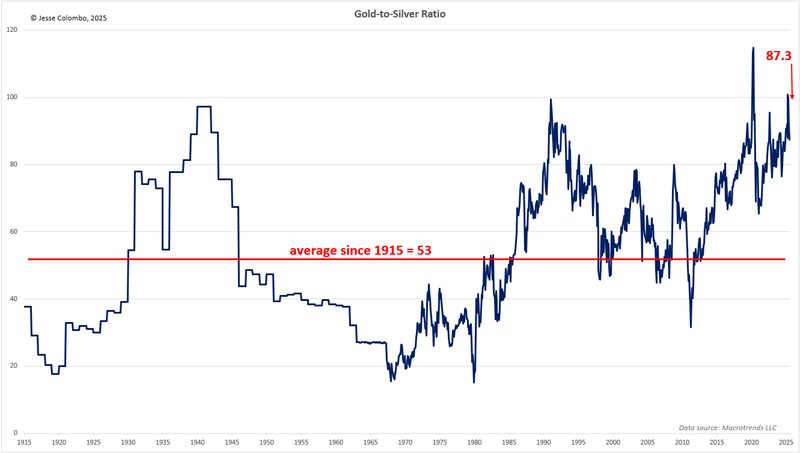
Despite silver’s recent strong performance, it still has substantial upside potential. Several valuation metrics — including the long-term gold-to-silver ratio — indicate that silver remains significantly undervalued.
The current gold-to-silver ratio stands at 87.3, but if it were to revert to its historical average of 53 (dating back to 1915) — without any increase in gold’s price — silver would be valued at approximately $63.30 per ounce, representing a healthy 65% gain from its current price of $38.40.
Naturally, as silver rises to close this gap, the ratio would decline accordingly.
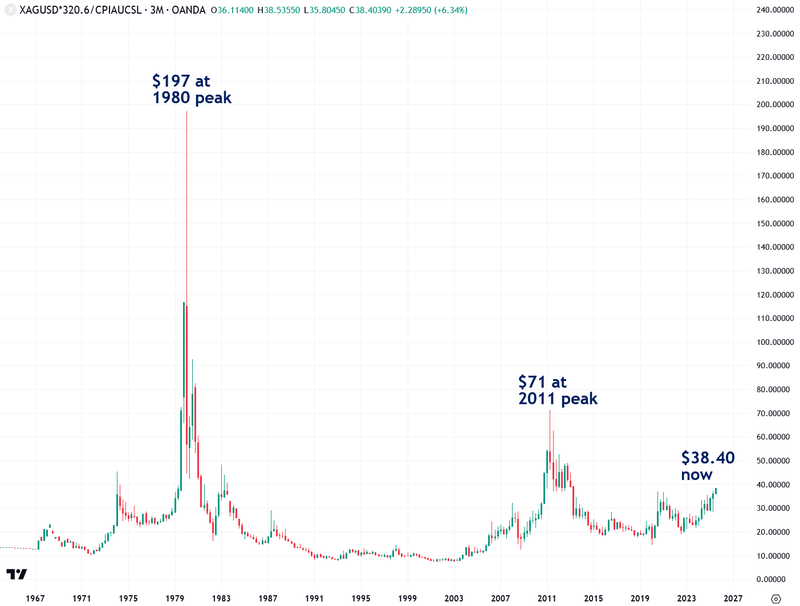
Adjusting silver’s price for inflation further highlights how undervalued it is by historical standards.
During the Hunt brothers-induced spike in 1980, silver reached an inflation-adjusted price of $197. In the 2011 bull market, driven by quantitative easing, it hit $71.
Currently trading at just $38.40, silver has significant room to rise if it’s to catch up with these previous inflation-adjusted peaks.
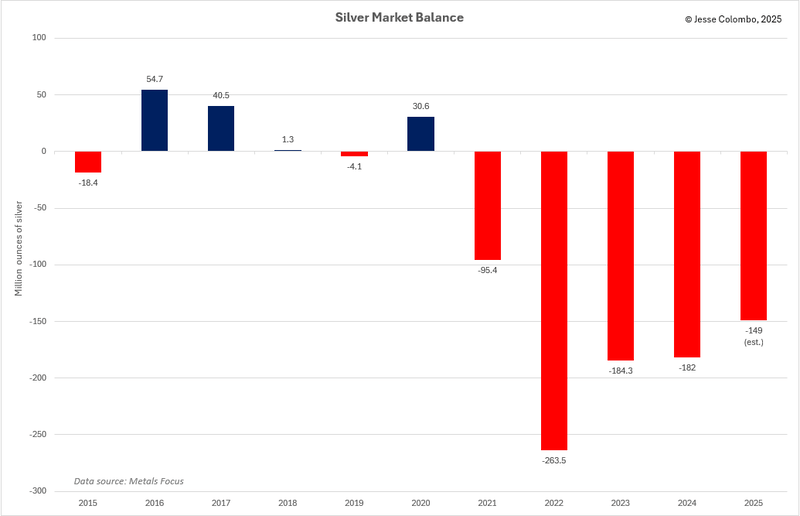
One key reason I believe silver will soon rally higher comes down to basic Economics 101: supply and demand. Over the past five years, silver demand has consistently exceeded supply, resulting in a persistent deficit—as shown in the chart below.
In 2024 alone, the shortfall reached 182 million ounces, with an estimated additional 117.6 million ounces this year—and deficits are expected to continue for the foreseeable future.
As a result, above-ground silver stocks are dwindling rapidly. While bullion banks can create unlimited amounts of paper silver to suppress prices, they can’t manufacture the real physical silver that is crucial for a wide range of industries, alongside growing investment demand.
The persistent silver deficit stems from both dwindling supply and surging demand—a combination that, in an unmanipulated market, would naturally drive prices higher.
That’s why I described silver as a beach ball held underwater over the past year — the pressure kept building, and it was only a matter of time before it burst upward.
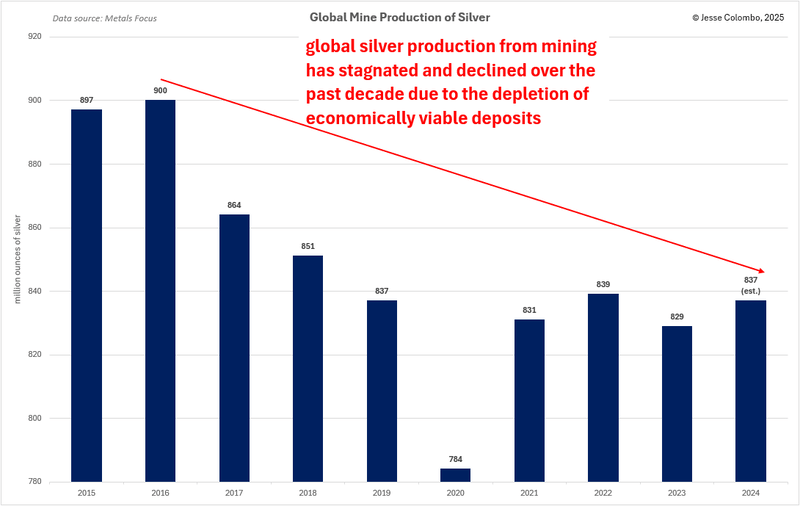
On the supply side, global silver mine production has peaked and declined over the past decade as economically viable deposits become depleted—something the bullion banks have absolutely no control over. And as time goes on, this supply crunch is only likely to worsen.
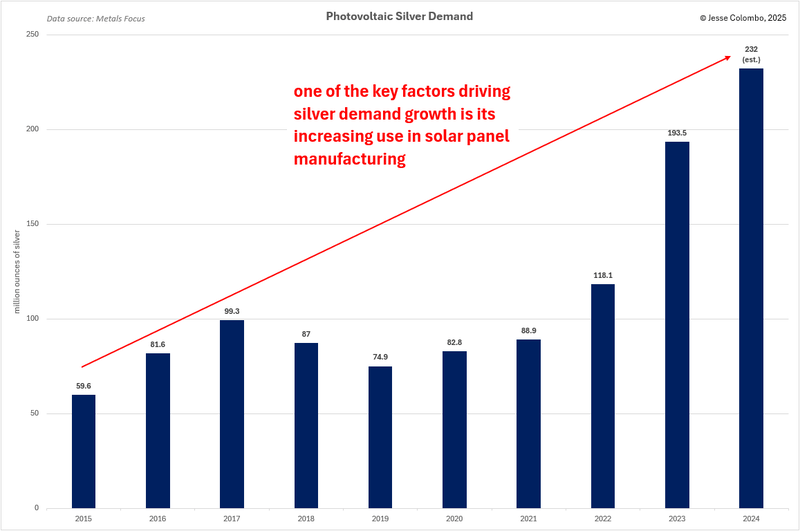
At the same time, demand for physical silver has skyrocketed across multiple sectors, with the biggest driver being the surge in solar panel manufacturing.
As the world shifts away from fossil fuels toward renewable energy, this trend is only in its early stages. Silver demand for photovoltaic (solar panel) applications alone has nearly tripled over the past four years, increasing by an astonishing 143.1 million ounces.
With global efforts to expand clean energy accelerating, this demand is set to grow even further.
In addition to the most obvious and straightforward approach — owning physical silver bullion — I also look to silver mining stocks for their amplified upside potential, especially as someone with a higher-than-average risk tolerance.
These stocks are leveraged to the price of silver and tend to move more dramatically—both up and down—so they’re not for the faint of heart. While riskier than holding bullion, they can offer explosive returns as silver truly takes off.
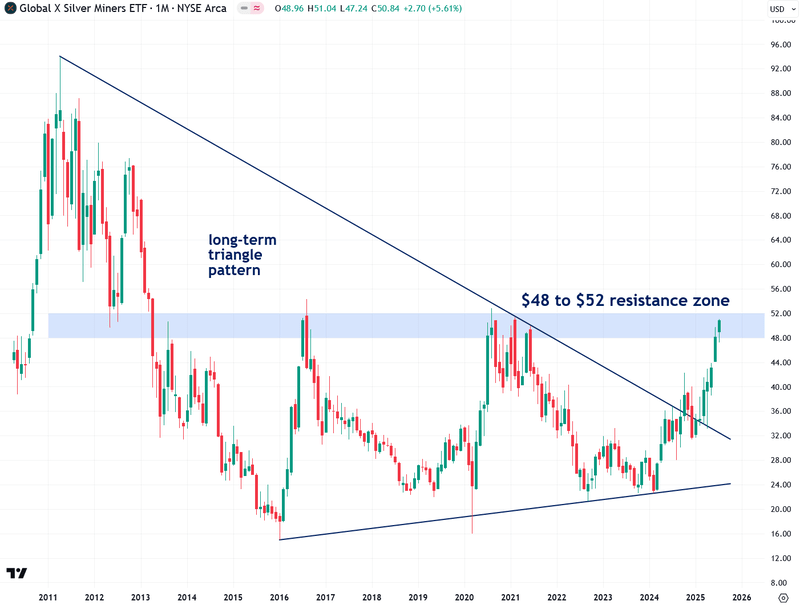
I use the Global X Silver Miners ETF (SIL) as a useful proxy to track the performance of silver mining stocks. SIL broke out of a long-term triangle pattern a few months ago, which is a bullish development.
However, a decisive close above the key $48–$52 resistance zone is still needed to fully confirm that the bull market in silver mining stocks is truly underway — and we’re getting very close.
To summarize: the moment I have been waiting for is finally here. Silver’s bull market has officially kicked off, and all systems are go. Now, I’m looking for continued follow-through on this breakout, which is highly likely given silver’s strong momentum.
Of course, it’s important that this breakout holds for my bullish tactical thesis to remain intact — but so far, the setup looks excellent, and I’m feeling very optimistic.
If you found this report valuable, click here to subscribe to The Bubble Bubble Report for more content like it.
********
More from Silver Phoenix 500


