Silver's Defining Moment


In our last silver market report we noted that September silver futures were coming up on an important test of a major supporting floor. We stated our opinion that "if broken, it will all but take the remaining wind out of the silver market's sails. At the time of our last writing September silver had closed slightly below $4.60 and we noted that a test of the nearby $4.50-$4.53 benchmark area beckoned. Sure enough, these lows were tested in the days immediately following and even exceeded slightly. The bottom rim of our parabolic bowl (which we drew in the daily chart from the early June highs down to the August lows) was penetrated on both a closing and an intra-day basis. So does this signal the proverbial "death knell" for silver? We'll attempt to answer that question in the paragraphs that follow.
While silver futures did break beneath the benchmark level we referenced in our last report, and while this must definitely be viewed as a sign of continued internal weakness, we took the liberty of redrawing the parameters of the parabolic bowl in the daily chart based on the contours of the price line, using the intra-day lows as guides for drawing the bowl. This is the way parabolic analysis should be done. Doing so yielded an interesting pattern, a deep 12-week bowl with prices currently resting right up against the lower rim of the bowl, to the right of center. We anticipated this possibility in the previous report in which we wrote, "If silver goes any lower than its intra-day summertime low of approximately $4.55 it would mean that prices have declined beyond the theoretical mid-point of the parabolic bowl, and this is nearly always bearish." As we've noted several times before, when prices bottom to the right-of-center, it is typically (but not always) a bearish development. In a healthy uptrend, following a counter-trend correction, prices tend to bottom right at the middle (or "vertex") of the bowl, sometimes even to the left-of-center. But bottoming beyond the vertex means there is weakness in the market that may not be fully worked out yet. We'll likely have our answer by the end of the week (Aug. 19-23).
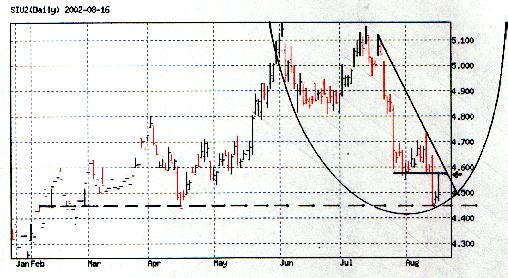
The underlying rim of the bowl in the daily chart (currently between $4.48-$4.50) also intersects a major benchmark supporting floor around the $4.45-$4.48 area. We've drawn a horizontal dashed line from February through the August lows on the daily chart to underscore this area. Note how many times at critical turning points in the past year this area has acted to reverse prices from downward to upward. Once again silver has encountered this benchmark, yet unlike the other times this past year, silver now has a heavy layer of overhead supply to contend with. This supply is highlighted with the downward-sloping trend line we've drawn off the most recent highs in July. Prices will encounter this supply once again this week, so we'll definitely find out just how much "juice" is left in the silver market. If silver is to see higher highs before the year is over, it must break above this line and follow its way up the parabolic curve. Doing so would effectively establish a powerful bottom above the $4.45-$4.48 chart zone and would indicate that silver has likely seen its lows for the year.
Finally, note the short horizontal line drawn connecting the lows in late July and through mid-August just before the mini sell-off last week. This level corresponds roughly with the $4.58 chart area and represents an important pivotal point. Breaking above the downtrend line this week and moving above this pivot would send an ideal trading signal for short-term traders. Keep these levels in mind in the early part of the week.
Of course, the prevailing trend in the silver market is still technically down and will continue to be so until the downtrend line is broken. While the recent benchmark support at $4.45-$4.48 did contain the price slide last week, a temporary reaction upon reaching this area was to be expected. Now the market will be forced to signal which side has the balance of power, supply or demand. This signal will likely be given sometime this week.
More from Silver Phoenix 500


