So Goes the Year?


- Multiple Bubbles
- No Credit Crunch
- “Two Bubbles Off Dead Center”
- Living with a Chef in Puerto Rico
You’ve heard the old stock market adage, “As goes January, so goes the year.” If so, 2022 will be a wild ride.
Of course, in this context “wild” doesn’t necessarily mean a loss. But it could, and given the well-documented human tendency to buy high and sell low, actual investors could easily lag behind even dismal-looking benchmarks.
The old and often-maligned, “It’s different this time,” is undeniably correct, too. We have never in market history seen anything comparable to the last two years. The virus itself, the fiscal and monetary policies it provoked, the market response to those policies… none of it has been remotely “normal.” We can’t rely on precedent when everything is unprecedented.
Today I want to wrestle with this problem. We’ll review what may be the most compelling bear case I’ve seen in a long time, along with some other unpleasant data. Then we’ll look at some equally compelling reasons those views may be wrong. The best metaphor I can think of is Christopher Columbus seeking a new route to Asia. He and his crew had only a vague idea where they were going… and no idea at all what they might run into first. We’re in truly uncharted waters.
Here I need your implicit promise. If you read the first section, you must read the second and third sections. I don’t want to leave you out on the ledge. The first two will generally be the opinions of others. The final section will be my own.
Multiple Bubbles
By the numbers, 2021 was a great year for stocks. The S&P 500 rose almost 27% in the course of setting many all-time highs. I was dubious that could happen but didn’t rule it out. Goldilocks came through with some help from Jerome Powell. The easiest monetary policy in history remained edible well past its sell-by date.
Those who thought the market overvalued a year ago weren’t necessarily wrong. Many different metrics said so. However, math allows an overvalued market to become even more overvalued, as this one did. The same could happen again, but we can have high confidence it won’t keep rising forever. At some point investors will be unwilling (or unable) to buy at these prices, forcing a downward adjustment. That point is certainly closer now.
As he did last year, this month GMO co-founder Jeremy Grantham, who has truly seen it all since the 1960s, issued a fascinating market outlook titled Let the Wild Rumpus Begin (a very clever quote from the fabulous children’s book, Where the Wild Things Are. )
Grantham’s subtitle succinctly captures his theme: (Approaching the End of) The First US Bubble Extravaganza: Housing, Equities, Bonds, and Commodities. In his view, this is a stock market bubble and more. Other asset classes are in equally precarious positions. He talks about the stock and other markets as being multiple standard deviations from trend. He refers to the two standard deviation differential as a 2-sigma event and the rare occurrence of a three standard deviation differential as a 3-sigma event and thus a “superbubble.” Quoting:
All 2-sigma equity bubbles in developed countries have broken back to trend. But before they did, a handful went on to become superbubbles of 3-sigma or greater: in the U.S. in 1929 and 2000 and in Japan in 1989. There were also superbubbles in housing in the U.S. in 2006 and Japan in 1989. All five of these superbubbles corrected all the way back to trend with much greater and longer pain than average.
Today Grantham says we are in the fourth superbubble of the last hundred years. In his view, the 2008 crisis was mainly a housing bubble. Stocks were just “normally” overvalued and had a “normal” bear market. What he sees now is quite different and it’s not just stocks. The closest historical comparison is Japan in the late 1980s, when stocks and real estate both climbed to nosebleed level at the same time.
Rather than summarize, I’m going to quote a key section from Grantham’s piece. It is so clear and compelling, I think you should get it straight from the source. Here’s Jeremy Grantham.
“The Dangers of Multiple Asset Bubbles at the Same Time”
“The Japanese case, in particular, made one thing pretty clear: while it is dangerous to have a bubble in equities—for the loss of value can cause a shock through the wealth effect that can get out of control, which was a part of the problem in 1929 and the ensuing slump—it is much more dangerous to have a bubble in housing, and it is very much more dangerous to have both together. The economic consequences of the double bubble in Japan are arguably still playing out. Exhibit 1 shows that neither the equity market nor land have yet recovered their 1989 peaks!
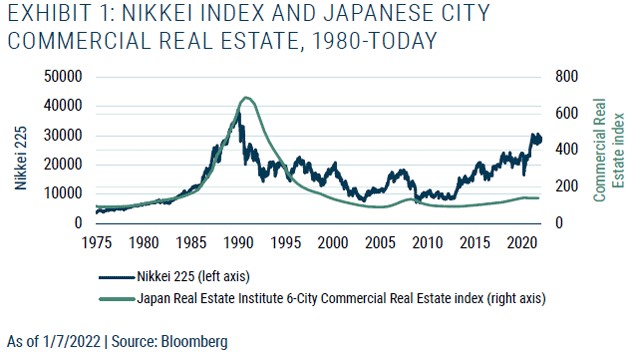
Source: GMO
“But now, for the first time in the US we have simultaneous bubbles across all major asset classes. To detail:
“First, we are indeed participating in the broadest and most extreme global real estate bubble in history. Today houses in the US are at the highest multiple of family income ever, after a record 20% gain last year, ahead even of the disastrous housing bubble of 2006. But although the US housing market is selling at a high multiple of family income, it is less, sometimes far less, than many other countries, e.g., Canada, Australia, the UK, and especially China. (In China, real estate has played an unusually important and unique role in the extended boom and thereby poses an equally unique risk to the economy and hence the rest of the world if its real estate market loses air exactly as it appears to be doing as we sit.)
“Second, we have the most exuberant, ecstatic, even crazy investor behavior in the history of the US stock market. The US market today has, in my opinion, the greatest buy-in ever to the idea that stocks only go up, which is surely the real essence of a bubble. (Interestingly, where other developed countries lead in housing prices, they lag the US in equity prices. Some, such as Japan, by so much that they are merely slightly overpriced today.)
“Third, as if this were not enough, we also have the highest-priced bond markets in the US and most other countries around the world, and the lowest rates, of course, that go with them, that human history has ever seen.
“And fourth, as gravy (as if we needed any) we have broadly overpriced, or above trend, commodities including oil and most of the important metals. In addition, the UN’s index of global food prices is around its all-time high (see Exhibit 2). These high prices are important as they push inflation and stress real incomes. The combination, which we saw in 2008, of still-rising commodity prices with a deflating asset price bubble is the ultimate pincer attack on the economy and is all but guaranteed to lead to major economic pain.
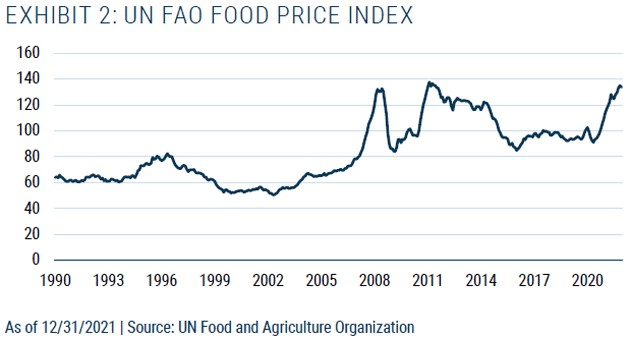
Source: GMO
“What our financial leadership should know is that multiplying these risks—these three-and-a-half bubbles—will multiply the total shock if the damage occurs simultaneously. And this package presents more potential for writing down perceived wealth than at any previous time in history. We wrote in 2007 that deflating US housing prices could directly lose $10 trillion or well over half a year’s GDP if house prices declined to moderately below trend—which they did. But at that time the bond market was merely overpriced at the risky corporate end and the stock market merely normally overvalued. (The stock market still halved in price in sympathy, if you will, with the main event—housing and housing-related debt.) 2 Yet despite that recent pain, all of the economic and financial dangers that are now building up from multiple major bubbles do not appear to be considered especially dangerous by the Fed or most of its equivalents around the world. In fact, the warning signs appear to be barely noticed at all.”
There are plausible arguments these four markets aren’t as bubble-like as Grantham thinks. We’ll look at some in a minute. Nonetheless, it is significant and ominous to have all this happening at the same time. It wouldn’t take all four (if they are all truly bubbles) to set off a calamity. A serious breakdown in any one of the four assets he cites—housing, stocks, bonds, commodities—would probably trigger at least one of the others, like the housing breakdown triggered the bear market in 2008 (in large part because it also involved a recession). That would be bad even if it ends there, and it may not.
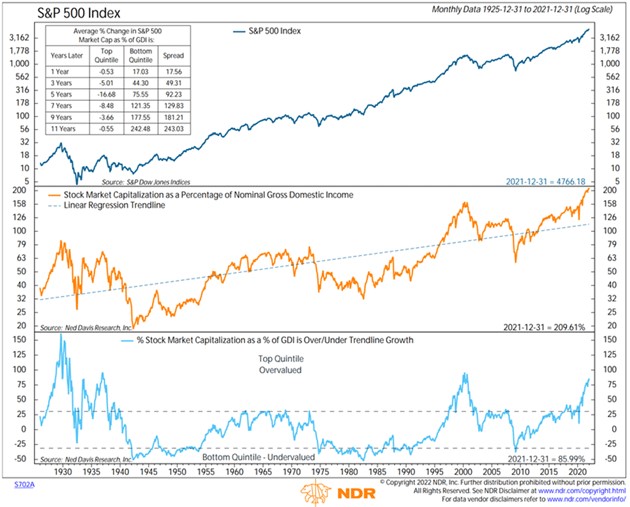
Let’s look at some rather disturbing metrics on the stock market. We will let the charts speak for themselves. First from the GMO piece linked above:
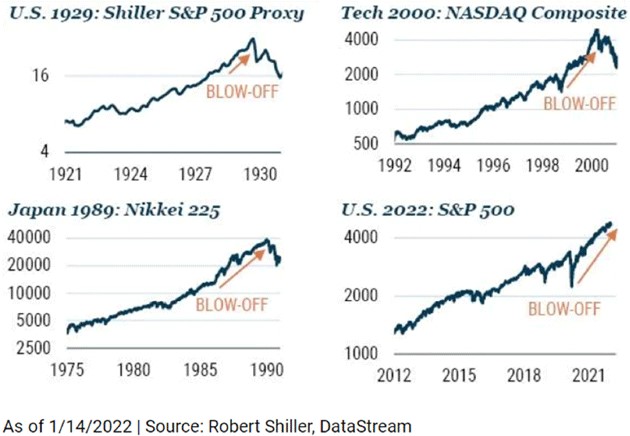
Source: GMO
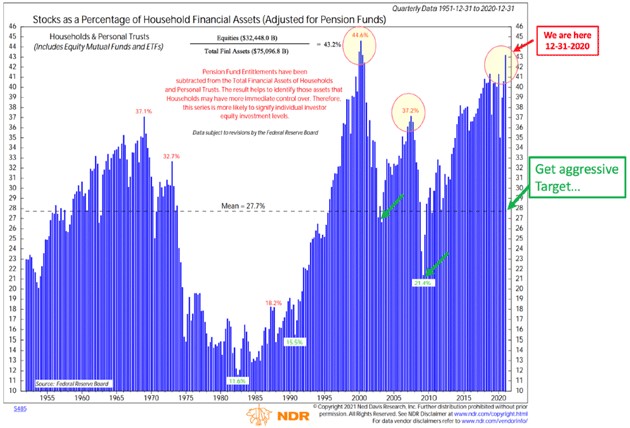
Here are several charts from my friend Steve Blumenthal’s recent letter . More to raise your eyebrows:
Source: CMG
Note the periods of above and over trend and what happened after in this next chart. See good entry points?
Source: CMG
Again, note historic entry points and what happens after peaks, and remember, we don’t know what constitutes a peak until long after it has been reached and rolls over.
Source: CMG
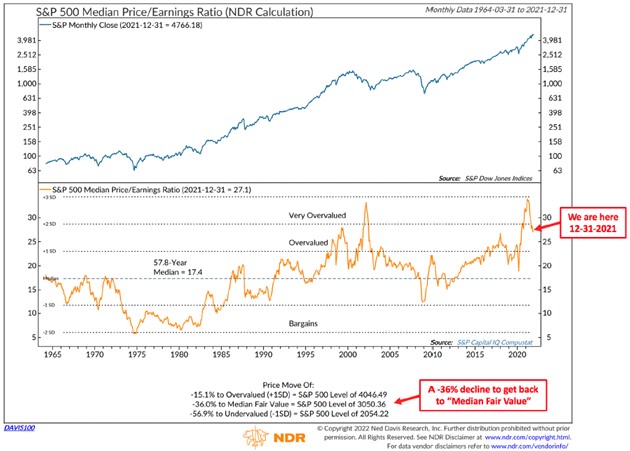
After showing multiple charts about what is expected to be future 10-year returns based on valuations, especially from peaks, Steve shows us this summary of various indicators in their current condition (from the prestigious and top-notch Ned Davis Research):
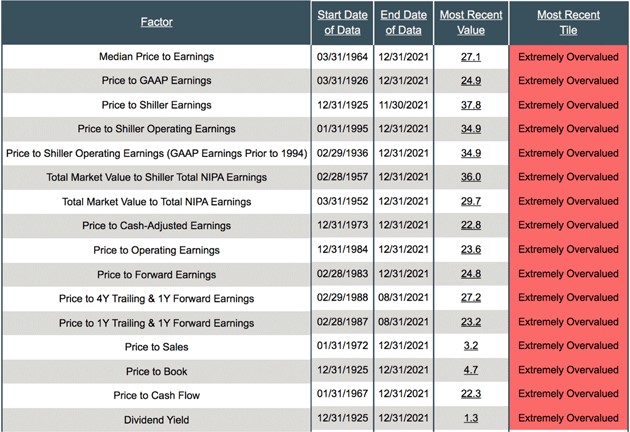
Source: CMG
Ouch. Now, a different approach.
No Credit Crunch
The economy is a giant machine of near-infinite complexity. Predicting the sandpile’s collapse may be all but impossible. And even if it is possible, brilliant people can see the same data and reach different conclusions. My good friend Ed Yardeni (whom I’ve been following for almost 25 years—time certainly flies) looked at Jeremy Grantham’s piece, acknowledged it makes some good and unsettling points, then offered his own counterpoints.
He began by saying bear markets usually spring out of recessions, which are usually triggered by credit crunches. What causes a credit crunch? Often it’s the result of monetary policy tightening. The Fed, while not there yet, is headed in that direction. But it matters a great deal how much the Fed tightens. Here’s Yardeni.
“It’s hard to imagine that the Fed will cause a credit crunch by raising the federal funds rate. It is widely expected that this rate will be up to 1.00% by year-end 2022 and 2.00% by year-end 2023. One reason that’s hard to imagine, as we have observed recently, is that there’s probably $3 trillion of excess liquidity in M2, as measured by its latest reading and the pre-pandemic uptrend in this series. It’s also hard to see inflation becoming so intractable that the Fed is forced to push the federal funds rate up to recession-causing levels, i.e., a ‘Volcker 2.0’ scenario.”
In other words, rates are now so deeply negative, the Fed can hike quite a bit without affecting credit conditions. Ed thinks inflation won’t get out of hand and provoke a Volcker-like tightening. If so, then credit could keep flowing fast enough to keep markets happy, though perhaps not at the recent torrid pace (or small corrections here and there).
Yardeni also thinks we will avoid recession this year. This is important. As we will see, recessions make a monster difference. A slowdown in goods spending is likely but it would give businesses opportunity to boost depleted inventories. Services spending should rise once we get past this Omicron wave and, along with pent-up vehicle demand, boost the economy later this year. This will keep inflation moderate and give the Fed a better shot at the “soft landing” scenario.
But most important, Yardeni thinks the stock bubble Grantham sees, if that’s what it is, is already deflating. The meme stocks, SPACs, and cryptocurrency booms are all losing air quickly with no dire impact on the rest of the market, at least so far. The giant tech stocks that have led the broad market higher (what Yardeni calls the “MegaCap-8,” still $11 trillion total market cap) are also correcting. Quoting:
“The S&P 500’s MegaCap-8 stocks (i.e., the eight highest-capitalization stocks in the index) collectively peaked at a record high on December 27 and fell 14.0% through Friday’s close. The MegaCap-8s account for about 50% of the market cap of the S&P 500 Growth stock price index, which peaked on December 27 and is down 13.0% since then through Friday’s close.”
*********
More from Silver Phoenix 500


