Soft And Softer Silver Fundamentals


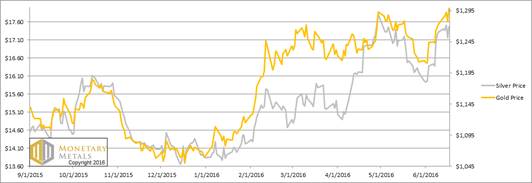
Last week we asked where will silver was headed. Well, the price moved around during the week, dipping on Thursday -- but then rebounding sharply on Friday. It closed up 13 cents from last week. During the same period the price of gold rose $24.
This week, the Federal Reserve announced that it will not hike rates. Most economists (and traders) have long been expecting a hike (not us). A hike is tighter monetary policy…and therefore not-hiking is a looser policy. Consequently, this equates to a greater quantity of dollars, which translates to higher metal prices. Everyone knows that (except us).
So naturally on the announcement, the price of silver blipped up about 20 cents. It continued to drift another 25 cents higher. And then cascaded downward almost 65 cents. Almost no one knows that prices, including the prices of the metals, have anything to do with the quantity of dollars (except us). Then the price began drifting higher, had another sharp drop…and then drifted back up again. It ended the week quite a bit lower than the post-Fed high of $14.85.
Folks, we have to say it. This is all noise. Not the non-hike. That is serious economics…that is undermining capital, crushing business profit margins, driving asset bubbles and ruining pension funds and banks. The Great Fed Falling Interest Rate since 1981 continues.
The price moves on these events. Over the long-term, only buyers and sellers of real metal can set the price. In the short-term, leveraged speculators can place big bets and thereby push or pull the price down or up from where it would otherwise be.
Let’s take a look at those buyers and sellers of real metal via the only true picture of the supply and demand fundamentals. But first, here’s the graph of the metals’ prices.
The Prices of Gold and Silver
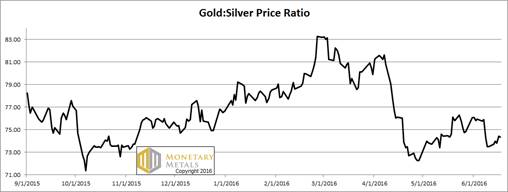
Next, this is a graph of the gold price measured in silver, otherwise known as the gold to silver ratio. The ratio was up a bit this week, interesting when the prices of both metals are up.
The Ratio of the Gold Price to the Silver Price
For each metal, we will look at a graph of the basis and cobasis overlaid with the price of the dollar in terms of the respective metal. It will make it easier to provide brief commentary. The dollar will be represented in green, the basis in blue and cobasis in red.
Here is the gold graph.
The Gold Basis and Cobasis and the Dollar Price
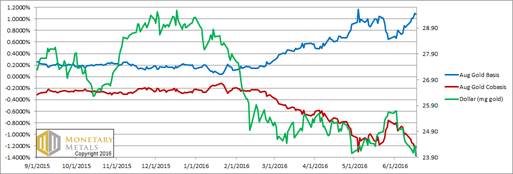
Look at that red cobasis line (i.e. scarcity of gold). It is dropping along with the price of the dollar (inverse to the price of gold, measured in dollars). It gets worse: gold becomes less scarce and more abundant the higher its price. Huh, that’s not what some gold promoters are saying, is it?
Our calculated fundamental price is down almost $40, more than $140 below the market price.
Now let’s turn to silver.
The Silver Basis and Cobasis and the Dollar Price
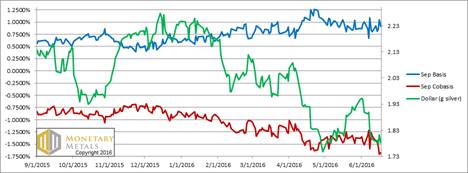
It’s a similar picture in silver. Note that the cobasis is at a (much) lower absolute level in silver, compared to gold (-1.7% vs. -1.2%).
The fundamental price fell over 30 cents, now $2.40 below market.
© 2016 Monetary Metals
 Dr. Keith Weiner is the CEO of Monetary Metals and the president of the Gold Standard Institute USA. Keith is a leading authority in the areas of gold, money, and credit and has made important contributions to the development of trading techniques founded upon the analysis of bid-ask spreads. Keith is a sought after speaker and regularly writes on economics. He is an Objectivist, and has his PhD from the New Austrian School of Economics. His website is www.monetary-metals.com.
More from Silver Phoenix 500


