S&P 500’s Rally – Record Breaking Advance Or A Bull Trap?


Stocks prices got even higher yesterday, as investors reacted to corporate earnings releases. Will the S&P 500 reach the new record high?
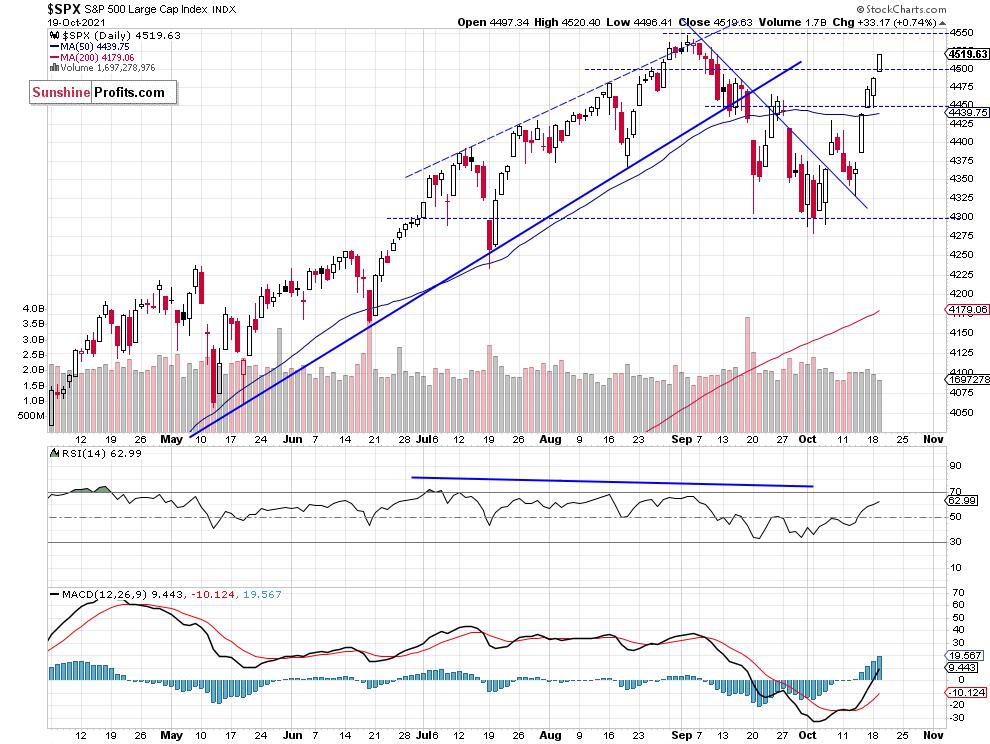
The S&P 500 index gained 0.74% on Tuesday, Oct 19 after breaking above the 4,500 price level. The broad stock market’ s gauge went closer to its Sep. 2 record high of 4,545.85. The quarterly corporate earnings releases are positive for the market and they are only starting to gain traction. Today we will get the TSLA earnings release and tomorrow INTC, among others. The market seems overbought in the short-term. However, there have been no confirmed negative signals so far.
The support level is now at 4,485-4,500, marked by the yesterday’s daily gap up of 4,488.75-4,496.41 and the previous resistance level. The next support level is at 4,440-4,450, marked by the last Friday’s daily gap up of 4,439.73-4,447.69. On the other hand, the resistance level is at 4,525-4,555, marked by the previous local highs and the early September topping pattern. The S&P 500 extends its advance after breaking above a month-long downward trend line, as we can see on the daily chart (chart by courtesy of http://stockcharts.com):
Dow Jones Is Also Close To the Record High
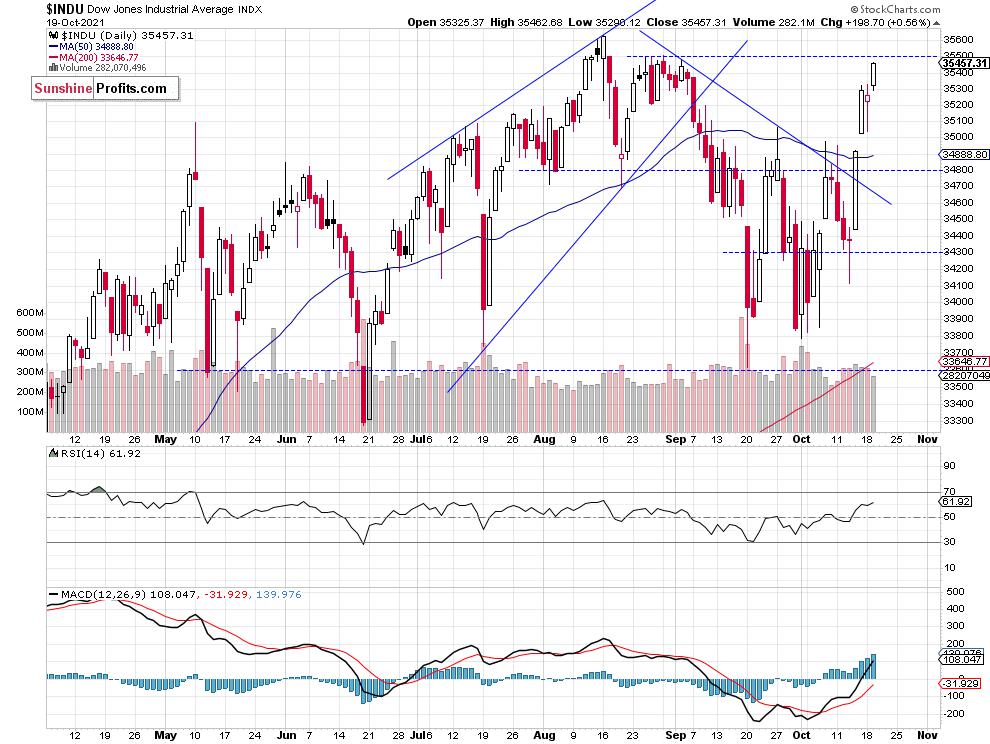
Let’s take a look at the Dow Jones Industrial Average chart. The blue-chip index broke above its over month-long downward trend line on Thursday, and on Friday it accelerated up above the 35,000 mark. Now, the nearest important resistance level is now at 35,500, marked by some previous local highs. The resistance level is also at the record high level of 35,631.19, as we can see on the daily chart:
Apple’s Relative Weakness
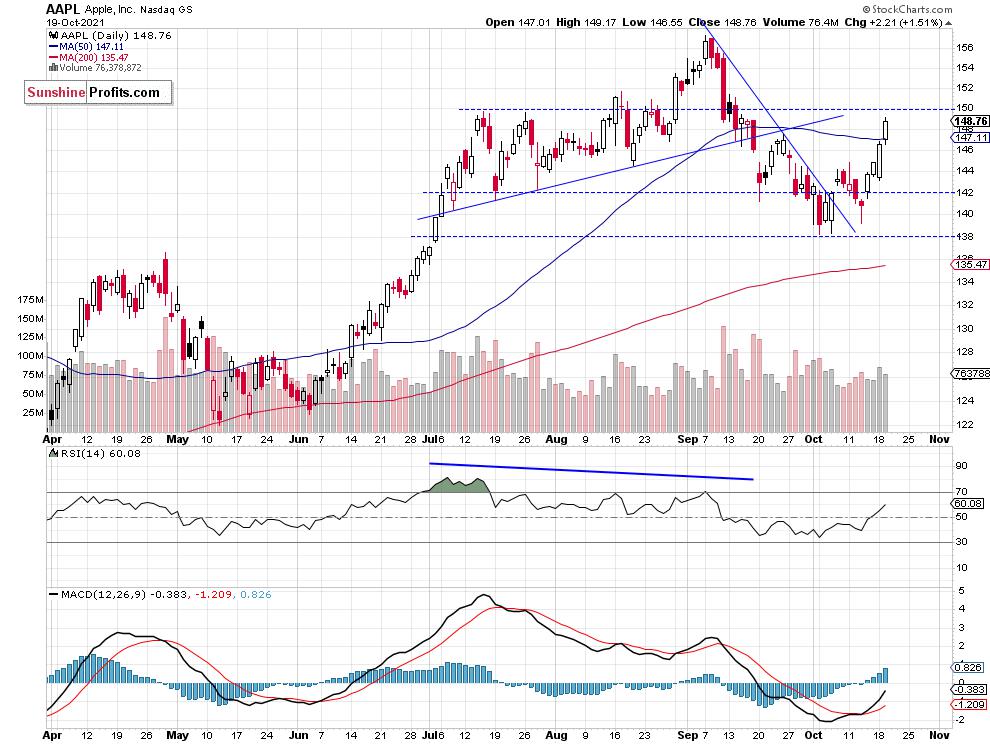
Apple stock weighs around 6.1% in the S&P 500 index, so it is important for the whole broad stock market picture. The stock broke above its short-term resistance level of around $144-145. The nearest important resistance level is at $148-150. The stock is relatively weaker than the broad stock market, as it’s still trading below the July-August local highs.
Futures Contract Gets Closer to the Record High
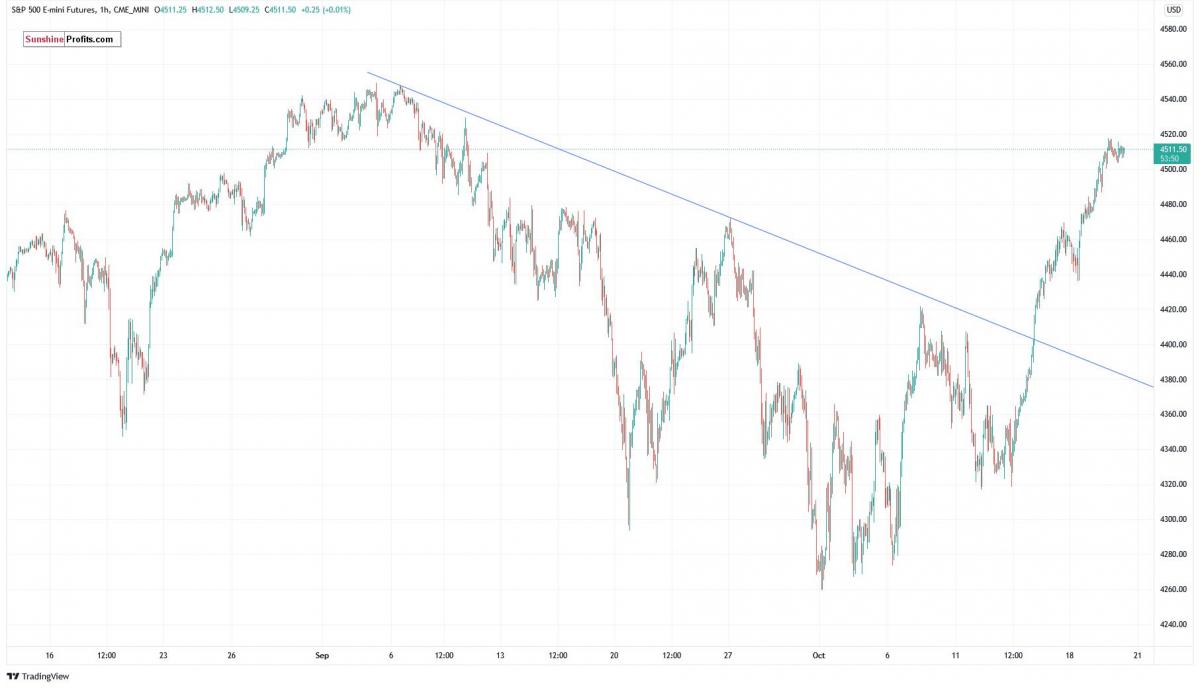
Let’s take a look at the hourly chart of the S&P 500 futures contract. On Friday, the market broke above its downward trend line and it broke above its previous local high of around 4,470. The nearest important resistance level is now at around 4,520-4,550, marked by the early September topping pattern. In our opinion no positions are currently justified from the risk/reward point of view. (chart by courtesy of http://tradingview.com):
Conclusion
The S&P 500 index further extended its uptrend yesterday, as it broke above the 4,500 level. It’s getting closer to the Sep. 2 record high of 4,545.85. The market seems overbought in the short term. However, the coming quarterly corporate earnings releases (today it’s TSLA, and INTC on Thursday, among others) are supporting buyers here. Today the market is expected to open virtually flat and we may see an intraday consolidation along the 4,500 level or a downward correction.
The risk/reward perspective seems less favorable right now and no positions are currently justified.
Here’s the breakdown:
-
The S&P 500 extended its short-term uptrend on Tuesday again, as it broke above the 4,500 level.
-
We are waiting for a more favorable risk/reward situation and will probably enter a new speculative short position in the near term.
Like what you’ve read? Subscribe for our daily newsletter today, and you'll get 7 days of FREE access to our premium daily Stock Trading Alerts as well as our other Alerts. Sign up for the free newsletter today!
Paul Rejczak,
Stock Trading Strategist
Sunshine Profits: Effective Investments through Diligence and Care
* * * * *
The information above represents analyses and opinions of Paul Rejczak & Sunshine Profits' associates only. As such, it may prove wrong and be subject to change without notice. At the time of writing, we base our opinions and analyses on facts and data sourced from respective essays and their authors. Although formed on top of careful research and reputably accurate sources, Paul Rejczak and his associates cannot guarantee the reported data's accuracy and thoroughness. The opinions published above neither recommend nor offer any securities transaction. Mr. Rejczak is not a Registered Securities Advisor. By reading his reports you fully agree that he will not be held responsible or liable for any decisions you make regarding any information provided in these reports. Investing, trading and speculation in any financial markets may involve high risk of loss. Paul Rejczak, Sunshine Profits' employees, affiliates as well as their family members may have a short or long position in any securities, including those mentioned in any of the reports or essays, and may make additional purchases and/or sales of those securities without notice.
********
More from Silver Phoenix 500


