S&P500 Extends Its Month-Long Uptrend…Will It Go Even Higher?


No speculative positions are justified In our opinion.
Our intraday outlook is now neutral, and our short-term outlook is neutral. Our medium-term outlook remains bearish, as the S&P 500 index extends its lower highs, lower lows sequence:
Intraday outlook (next 24 hours): neutral
Short-term outlook (next 1-2 weeks): neutral
Medium-term outlook (next 1-3 months): bearish
Long-term outlook (next year): neutral
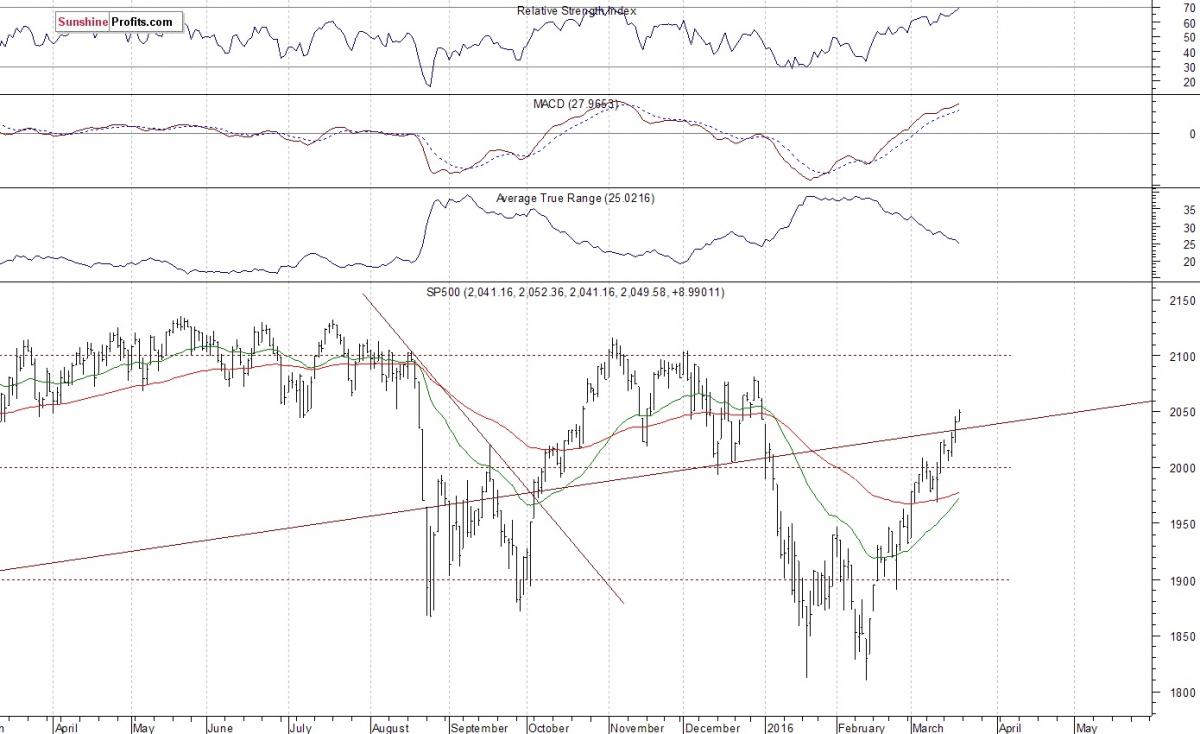
The main U.S. stock market indexes gained 0.2-0.7% on Friday, extending their short-term uptrend, as investors reacted to some economic data releases. The S&P 500 index is at the resistance level of 2,050, after breaking above the level of resistance of 2,040, marked by the early January daily gap down at 2,038.20-2,043.62. The next important level of resistance is at around 2,080, marked by the late December local high of 2,081.56. On the other hand, support level remains at 2,000 mark, and the next support level is at 1,960-1,980, marked by previous level of resistance. There have been no confirmed negative signals so far. However, we can see some technical overbought conditions. Will this uptrend extend even higher? The index continues to trade within a slightly descending medium-term trading channel, as we can see on the daily chart:
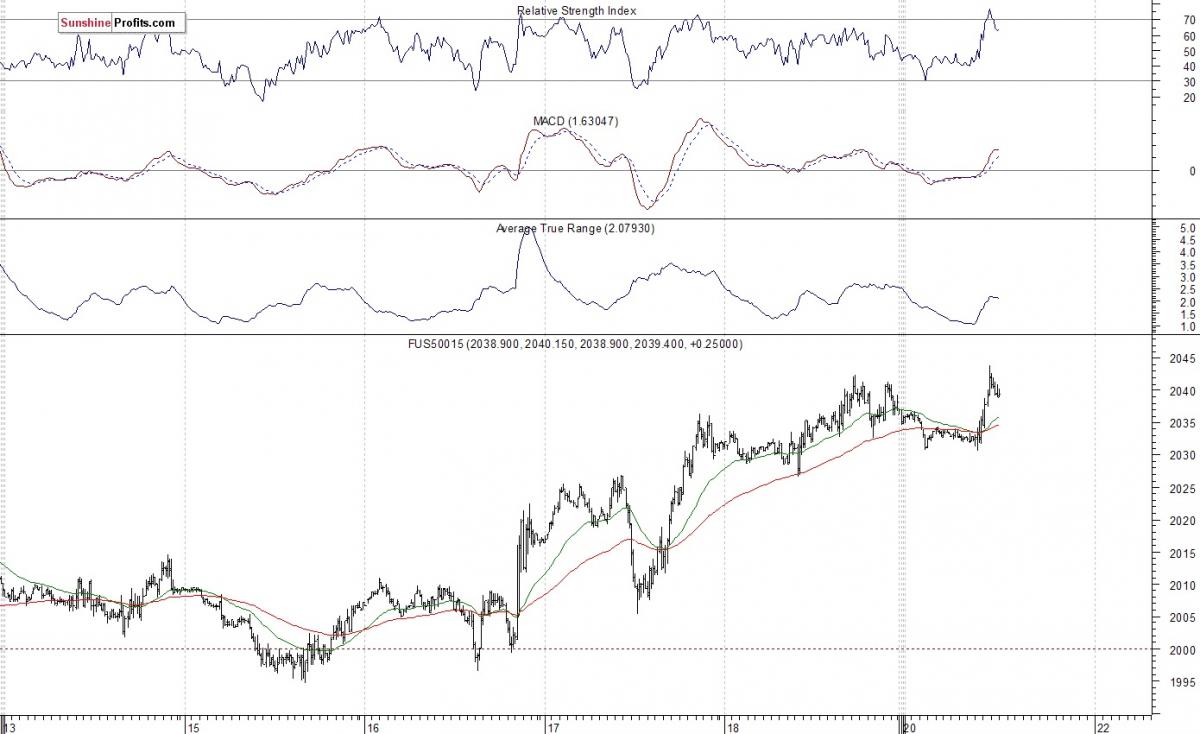
Expectations before the opening of today's trading session are slightly positive, with index futures currently up 0.1%. The European stock market indexes have gained 0.2-0.6% so far. Investors will now wait for the Existing Home Sales number announcement at 10:00 a.m. The S&P 500 futures contract trades within an intraday uptrend, following Friday's fluctuations. The nearest important level of resistance is at around 2,040-2,050. On the other hand, support level remains at 2,025-2,030, marked by recent local lows, as the 15-minute chart shows:
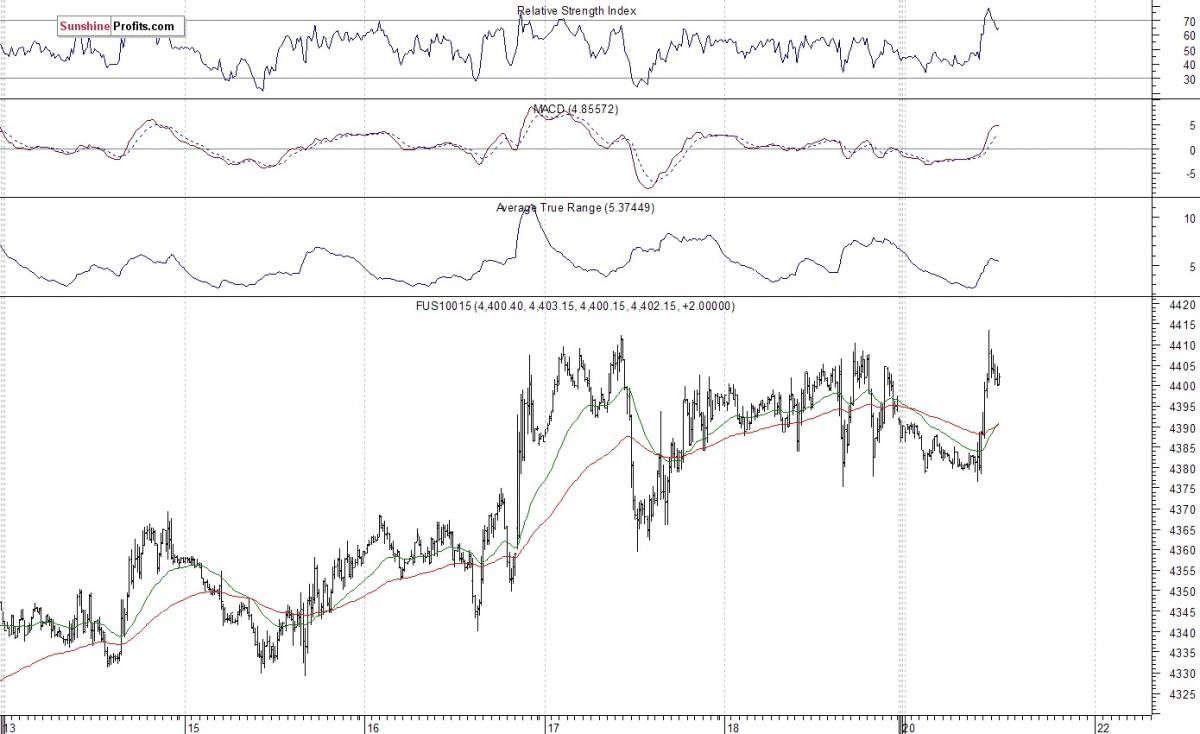
The technology Nasdaq 100 futures contract follows a similar path, as it currently trades close to the level of 4,400. There have been no confirmed negative signals so far. The nearest important level of support is at around 4,375, marked by some short-term local lows. Is this a topping pattern or just consolidation within a short-term uptrend?
Concluding, the broad stock market continued its short-term uptrend on Friday, as investors' sentiment improved even further following economic data releases, among others. The S&P 500 index has retraced most of its January sell-off. But will it continue higher despite some technical overbought conditions? There have been no confirmed short-term negative signals so far. Our speculative position has been closed on Friday, at the stop-loss level of 2,050 (S&P 500 index). We lost 55 index points on that trade, betting against month-long uptrend. It is always important to set some exit price level in case some events cause the price to move in the unlikely direction. Having safety measures in place helps limit potential losses while letting the gains grow. Currently, we prefer to be out of the market, avoiding low risk/reward ratio trades. We will let you know when we think it is safe to get back in the market.
********
Courtesy of SunshineProfits.com
More from Silver Phoenix 500


