Is This The Start Of A Silver Bull Market?


The last update was wrong. Silver was expected to drop with the stock market, but instead it held its ground and then broke higher last week. The reasons for this misinterpretation, both for gold and silver, are set out in the latest Gold Market update, and will not be repeated here.
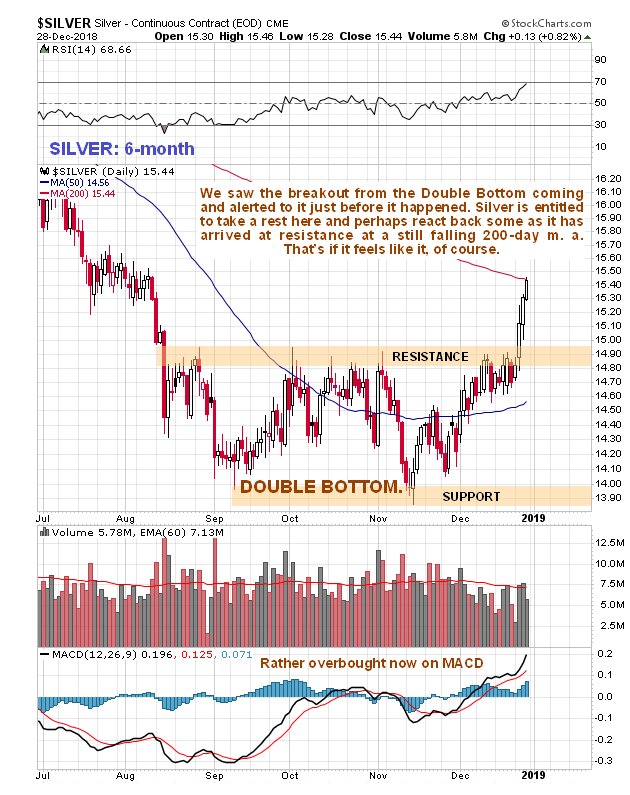
On the 6-month chart we can see that while gold continued to advance in December, albeit incrementally, silver continued to be restrained by the resistance at the upper boundary of what is now clear is a Double Bottom base pattern, until several days ago when, under increasing positive influence from gold, it broke clear above it. Since it has arrived at resistance at its falling 200-day moving average it is entitled to take a rest here, if it feels so inclined, and consolidate or perhaps react back a little. This breakout bodes well for the longer-term and may well be the opening shot of a major bull market.
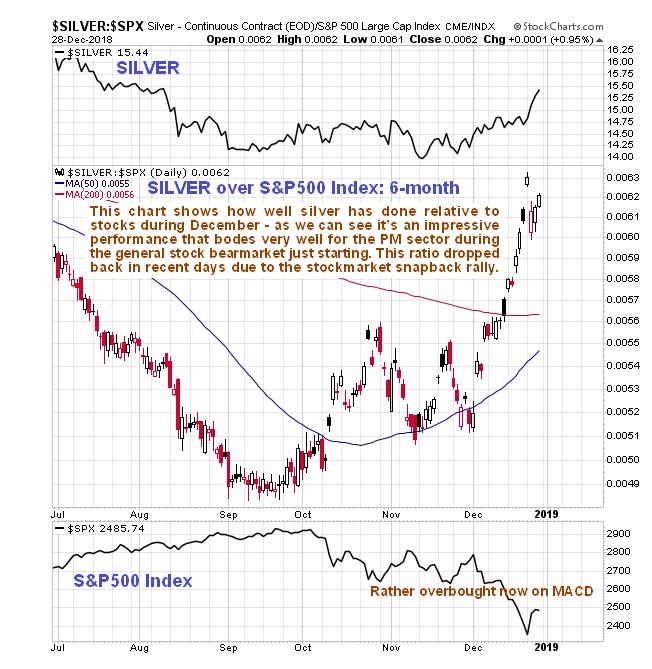
Although silver’s action of the past few weeks may look like no big deal on the straight silver chart, it looks a whole lot more impressive on the chart for silver relative to the stock market. This chart shows that silver was a helluva lot better place to be in recent weeks than the stock market. This chart also implies that silver is going to continue to perform well as the great broad stock market bear market unfolds, in marked contrast to what happened in 2008, for reasons that are set out in the latest Gold Market update, that apply to both gold and silver.
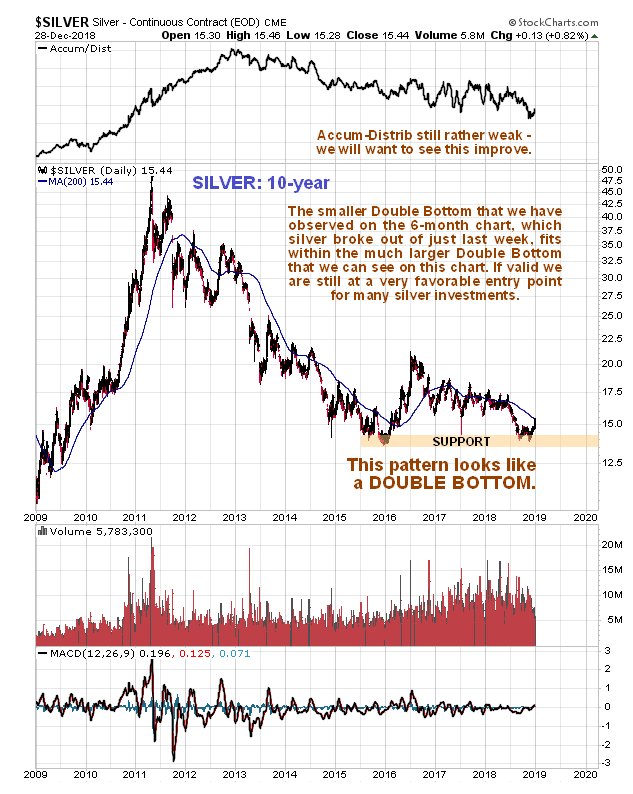
In light of this break higher, the 10-year chart for silver also looks a whole lot better than it did just a short while ago. This is because silver appears to be starting to ascend away from the 2nd trough of a much larger Double Bottom, within which the much smaller Double Bottom shown on the 6-month chart is embedded.
Note that the latest COTs are not included in this update because they have been delayed by the Christmas holidays, and will become available early this coming week.
Now we will look at a most inspiring chart which shows that, regardless of near-term fluctuations, if you invest in the precious metals sector here, you will have the deck heavily stacked in your favor. The PM sector has been about the only one that hasn’t become a bubble in recent years, and the way things are shaping up, it could wind up being the only sector that becomes a bubble while most everything else is dropping through the floor.
This chart is the one showing the silver to gold ratio which recently reached a 24-year record extreme as shown by the 20-year chart for this ratio below, which alone is a sign that the sector is close to a bottom and also that a major new bull market is likely to start before much longer.
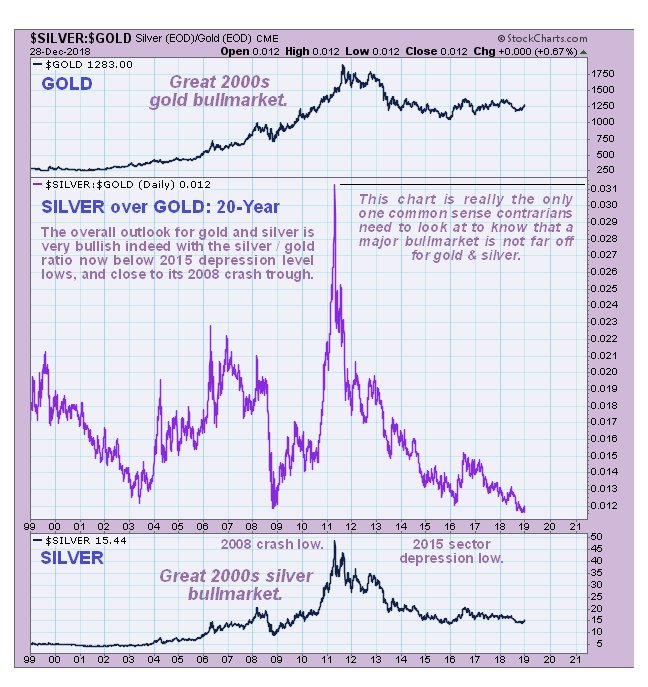
Extreme low readings for this ratio have occurred three times in the past 20 years, each time leading to either a bull market or a big rally. The low reading in mid-2003 lead to the bulk of the 2000’s precious metals sector bull market. The low reading in 2008 lead to the big post 2008 crash recovery in the Precious Metals (this time gold and silver DO NOT look set to drop with the market, because of the more negative outlook for the dollar), and lastly the low reading early in 2016, when PM stocks were crazy cheap, lead a big rally into July of that year. The ratio has just been below that low.
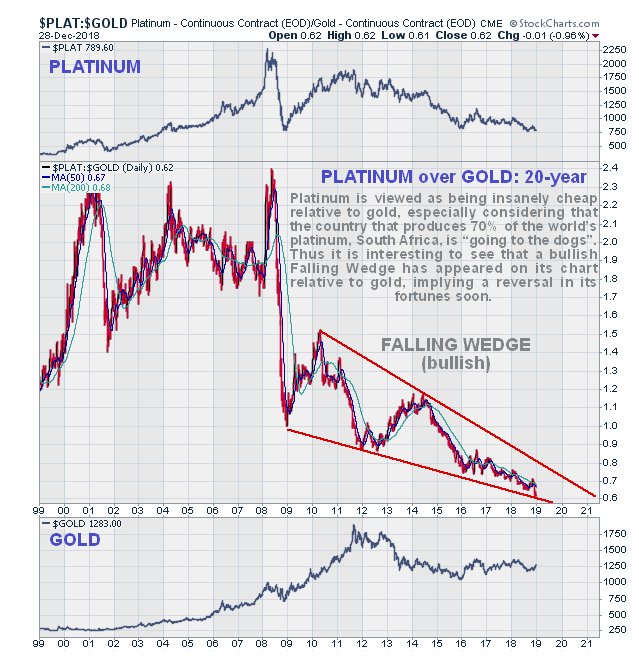
Finally, it is worth taking a sideways look at the 20-year chart for the platinum over gold ratio, which reveals that platinum is astoundingly cheap compared to gold—at a 20-year plus record low. What is all the more surprising about this situation is that it exists at a time when the world’s biggest platinum producer by far, South Africa, which produces about 70% of it, is going to the dogs, as the country is run by zealots who appear to be intent on taking the same ruinous road as Zimbabwe after Mugabe took control. The bullish Falling Wedge visible on this chart implies that platinum is going to break higher soon and probably outperform both gold and silver as all three metals embark on major bull markets.
********
Clive Maund has been president of www.clivemaund.com, a successful resource sector website, since its inception in 2003. He has 30 years’ experience in technical analysis and has worked for banks, commodity brokers and stockbrokers in the City of London. He holds a Diploma in Technical Analysis from the UK Society of Technical Analysts.
More from Silver Phoenix 500


