Stock Market’s Caged Bear About To Rattle Himself Loose!


I’ve been saying the stock market will take a turn for the worst sometime between mid-August and October. Numerous market metrics now show a market that looks ready to turn over. The bear may soon be back in charge.
The futility of trying to stop the stampeding herd and the Fed fallacy
When I pointed out last January that the market was more perilously overpriced than ever and imminently ready to crash, the stock market took one of its most spectacular dives in history just a month later. (See: “Stock Market More Overpriced and Perilous Than Anytime in History.”)
Before the market plunged, I showed that Fed juicing (quantitative easing) was at all-time highs and continuing. That, I noted, made my prediction highly unlikely by most accounts.
The Fed is back to easing — back to doing what it does to juice markets up. And the correspondence between what central banks do with their balance sheets and what the stock markets do is now almost 100%.
I illustrated that with the following graph:
Yet, make my prediction I did.
Giddy investors on some sites tried to scorch me under their burning belief that the market couldn’t possible fall because the Fed had its rigging all firmly in hand, even though I had noted I was well aware of that. I replied the market was going to fall anyway — likely soon and certainly hard.
My article about the market’s impending and likely severe fall included this comment:
The more the market’s metrics move above all rational and historic benchmarks, as I’ll show they now have, the greater its fall will be if the Fed pulls the plug, AND the more sensitive it will become to the Fed even wiggling the plug. So, the situation is, in that sense, more perilous than at anytime past because some of the market’s most fundamental valuation metrics are now printing at levels never seen before.
What a fool I was, scoffed some stock advisors and investors who read my article or whose eternally optimistic articles I wrote comments on based on my article.
Then COVID flew in like a black swan and crushed the global economy. The Fed entirely lost control, and the market fell screaming, knowing the Fed couldn’t save it. The Fed’s enormous money pumps also screamed, as the Fed ran them as fast as it could for two weeks. Yet, the market kept right on falling through the floor and through the sub-basement because the market had a long way to go to catch down to economic reality.
In spite of the whirring money pumps (or brrring of its money press), the Fed was completely unable to arrest the market’s plunge until the federal government stepped in alongside it and applied an additional $3 trillion in muscle. And that’s why I wrote in May, “The Fed is Dead.”
The scoffers, as always, never returned to say they were sorry for calling me an idiot or even admit they had been wrong.
As you can see, with even more hindsight than was available in mid-May, the Fed pumped the market harder than ever before (and the following graph doesn’t even show all the government help that came in alongside the Fed to finally rescue the market). Yet, still it couldn’t get the market to rise without government muscles joining it.
The Fed has hardly dared wiggle the plug at all since then. It did a bit in June, but didn’t dare go far with that as it tries to stabilize its balance sheet at the new normal of $7 trillion, below which I am telling you it dare not fall because the pit of hell lies below.
I could stop with that success and take no further chances on predicting the insane stock market, and that is tempting, as I mostly get ridiculed when I predict a market downturn in the face of running bulls; but I’m not one who runs with the herd. Herds stampede off cliffs. That is how Indians so successfully killed a lot of other bulls in times past:
I’m one who stands alone (or, at least, with very few) like the boy in Dances with Wolves in the face of the stampede. I’m all about giving a clear warning of the economic cliffs ahead, not about playing it safe with my counsel by predicting what the experts predict.
Other than a few supporters here, no one thanked me for the thousands or maybe millions I might have saved them in March, had they listened. All they did was return to scoffing as soon as the market started going up again, saying, “See, we are right again.” Well, maybe, but you could be a million dollars more right if you had stopped before running off the cliff!
Regardless, I’ve been yelling against the noise of the stampede since May that the economy’s lack of recovery would become apparent by mid-July, in spite of what the herd believed about a V-shaped economic recovery. I also said stock investors would take a little longer to catch on than anyone else because they’re bullheaded like that. They are so irrational right now. They are running on testosterone, not brain power.
Still, I said, it wouldn’t take long before the market would turn, too, putting the present timeframe squarely in view. The time of testing has now come. In this ongoing battle of the bulls and the bear, and I continue to stand by what I’ve warned will happen, even as the bullish stampede reaches a feverish drone of thundering hooves.
I don’t do it because I believe it will turn a single thick bullish neck. I know it won’t. I just do it because I think it is right.
Market running toward a more perilous overhang than ever before
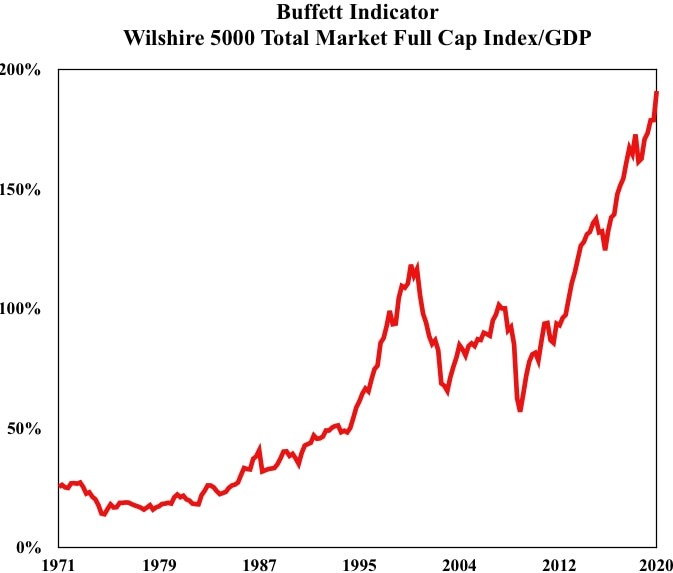
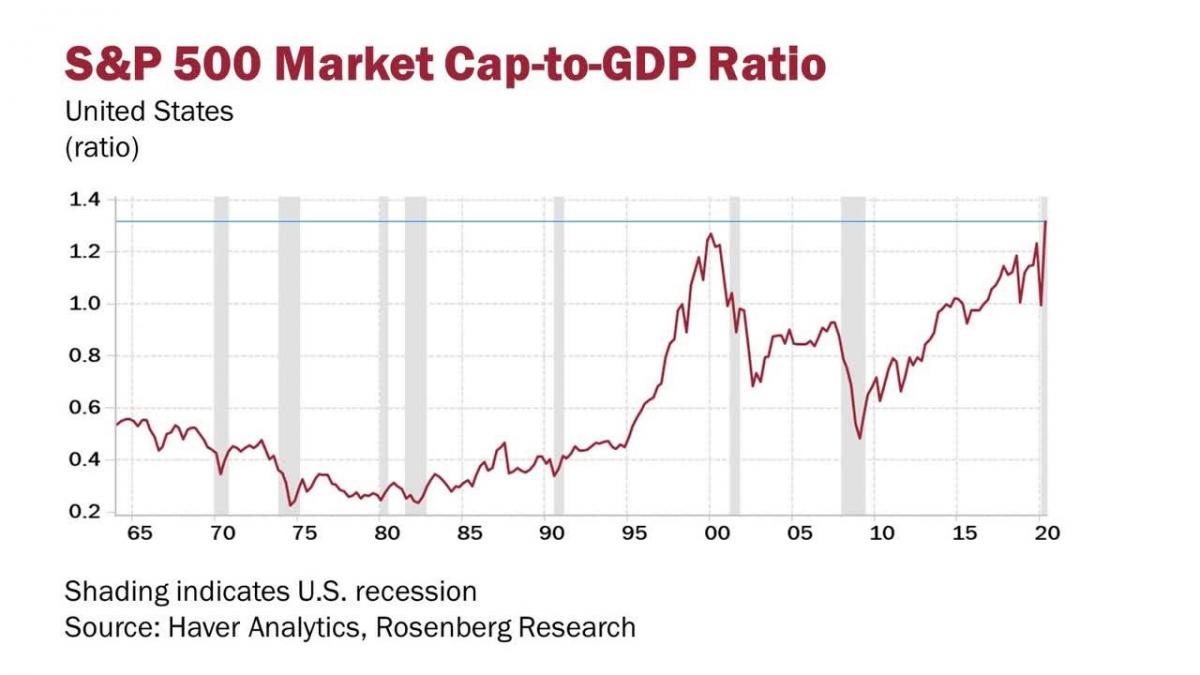
The Warren Buffett Indicator is now at all-time highs:
(This is the one that tells Warren when prices are way, way too overvalued)
Let me start this second clarion call about the perilous market this year with a comparison between how overvalued we were in January when I first shouted out about perilous overpricing to where we are now, which is so much worse. (Many may say, “Well you were right back then only because COVID-19 bailed you out.” Maybe, but what will they say this time when they miss seeing how perilous the market is crashing when the next black swan swoops in and spooks the bulls over a cliff?)
Back in January, by two common metrics, the stock market was as overpriced as it was just before the dot-com bust:
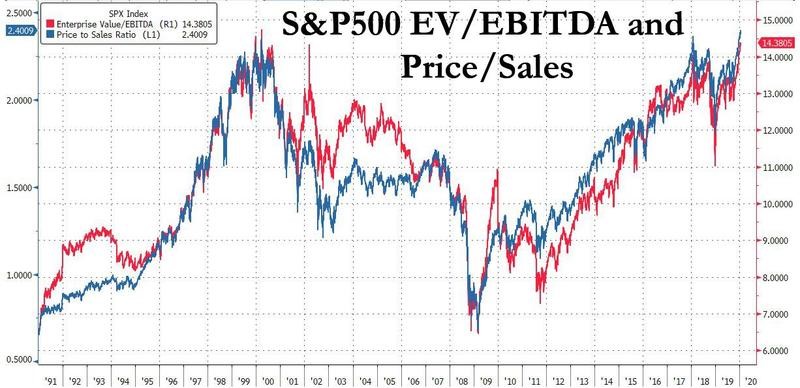
When the S&P hit that level in late 2018, it fell off a cliff, just as it had done in 2000. When it hit slightly above that level again in January 2020 (the very end of the graph), it fell off a much greater cliff.
That’s where we were then on the measure of the S&P price-sales ratio. Here is where we are now:
S&P 500 Historic Price-Sales Ratio All-Time High
Even higher.
By that measure, the market is more overpriced and, therefore, more perilously close to the edge of the cliff, but I have many other instruments that show the market’s perilous perch and its likelihood of running over the edge soon.
I prefer to give the price/sales ratio versus the price/earnings ratio as a real-life metric because we all know by now that earnings are completely manipulated by corporate share buybacks in that “earnings” are really “earnings per share,” and corporations have been buying back shares for the past decade like no other time in history. As a result, the P/E ratio is now worthless as a true historic metric; but sales are what they are as a measure of real business activity. Nevertheless, for those who prefer forward price earnings, here they are …
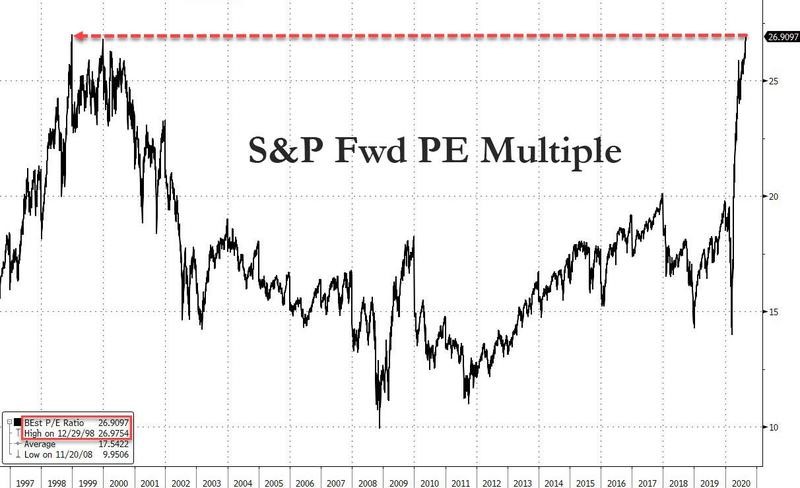
… knocking on a ceiling touched twice before at a time that quickly and badly failed. In January, they were slightly below that historic high. That chart was two days ago, however, and the S&P has only shot up from historic high to hysteric high, while you can be certain forward projected earnings have not improved — not if anyone projecting them has a brain … though who knows if brains exist anymore? So, now forward’s PE multiples are almost certainly above that all-time high.
In more tabular form, that nonsense looks like this (where a normal PE ratio would be somewhere between may 13 times earnings to 17 times earnings):

OK. That’s insane.
When I wrote about how perilously overpriced the market was in January, most people thought it couldn’t possibly fall because the Fed had it firmly under control. Now they already think the same foolhardy thing all over again … as if COVID could not possibly have more nasty surprises in store, as if the election could not possible turn the country to greater economy-wrecking chaos, as if the millions of homes now avoiding default solely because of forbearance could not possibly fall into default and then foreclosure in one month now that forbearance has ended, as if a million people still losing their jobs in each and every weekly report couldn’t start to outweigh the job recovery that came from reopening, which has run its course already, as I said it would … as if nothing bad could possibly happen at all … just like in January. Oblivious.
Now that only half a dozen stocks are carrying the S&P up and rocketing the NASDAQ to the moon again, now that Apple is responsible for 98% of the market’s gains, let’s look back at the difference between the NASDAQ and the S&P 500 for a story of head-splitting divergence. By this measure, we have passed the hysterical heights the NASDAQ reached just before it broke in the dot-com bust when non one thought it could. Here is where NASDAQ is relative to the S&P today:
TABR Capital Management “Party Like It’s 1999”
So, you cannot say this rally isn’t as overpriced as in the dot-com bust or that the rally is based on any more realistic expectations of future earnings than we had in 2000 that would justify this pricing ahead of the rest of the market.
We are quite simply in the highest nose-bleed section in stock-market history, sitting on the narrowest ledge of support as Apple now makes up 98% of the broad, Main-Street Russell 2000:
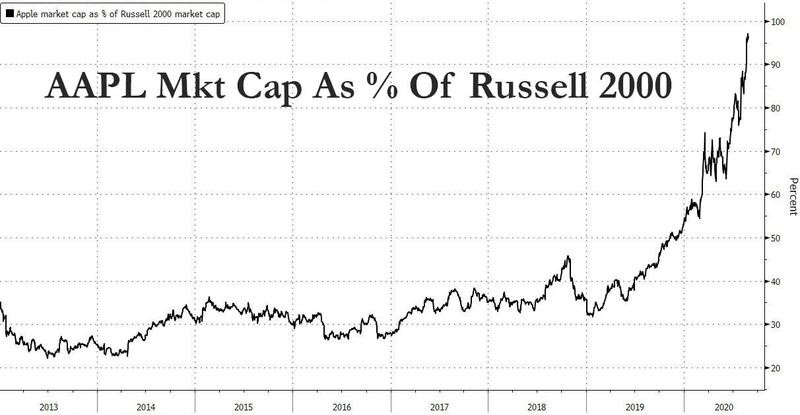
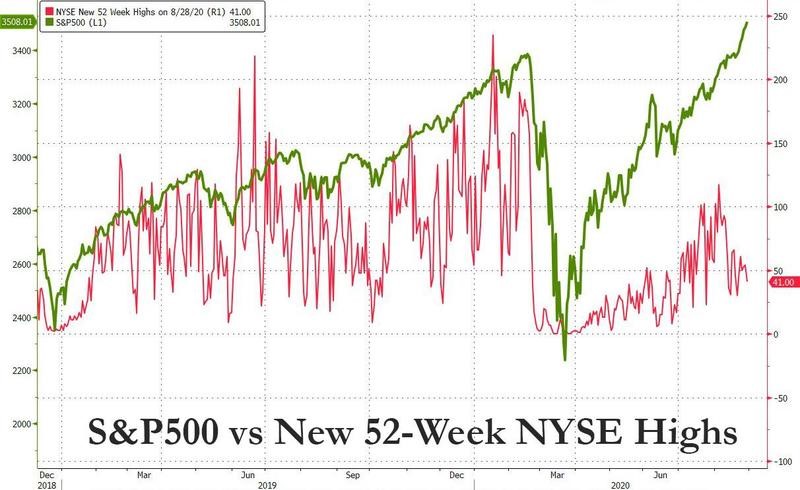
As Zero Hedge says,
A few more trading days, and one company will be more valuable than all small public companies in the US combined.… Underscoring the lack of breadth, just 41, or 1.3% of the 3,068 NYSE stocks hit a new 52-week high on Friday when the S&P500 closed at a record 3,508, yet another unprecedented divergence.
Note the difference in how stocks have diverged before and after the COVID-crackup:
As Lance Roberts recently wrote, it’s a tale of two markets. He says of “two bull markets,” but one of the bulls is an all-out bear, even though people think this is a bull market and not without reason:
One part of the market is trading as you would expect with near depressionary economic numbers. The only description for the other part is “insane.”
While the NASDAQ is stratospherically insane compared to the S&P, the S&P is running a familiar cliff edge, too. Just as in 2000, 2007/8, 2018 and the start of 2020 — all times when the S&P crashed — the S&P is back to record deviation above its 200-week moving average.

Lance claims that, as bad as the great crash of 2020 was, the S&P is back to those heights because it never really broke its bull-market trend. He uses the following graph to show that, bad as the cliff-fall was, it never broke the spine of the market’s lower trend line:
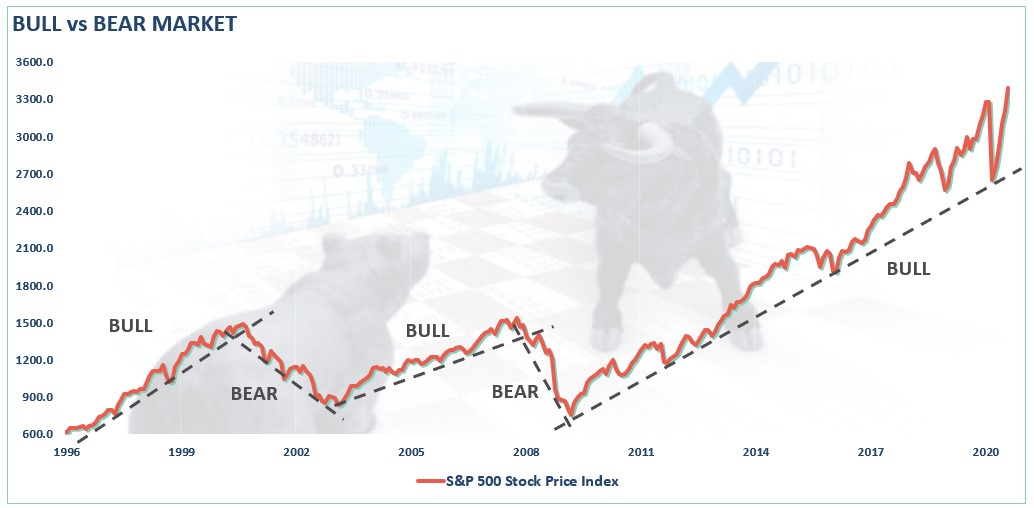
The market was simply so overpriced, just as it is now, that a 35% plunge was but a mere correction, which only took the S&P back to the bottom trend line of the long bull market created from Fed financial fortification. Now it is even more overpriced in terms of that trend line.
It is because the market never really broke through that bottom, that I have kept saying it has much further to go to catch down to the steeply falling economy. In the very least, I expect the S&P to drop to around 2200 on the S&P in its next plunge just to get back a little reality.
Ultimately, though, I expect the stock market to monkey-hammer its way through that bottom and fall into the pits of hell where the economy now lies in ruin because reality wins the day in the long run … even over the now impotent Fed (the Fed that can’t move the market without Trumpian government assistance) and certainly over all the vain hopes of stocktards. Only the hubris of human beings likes to think otherwise.
However, I also expect both Fed and feds will do all they can to lift the market when it crashes. So, I don’t anticipate a straight plunge to the bottom of this yawning depression. It’s going to be a war between the uncaged bear the bulls into the pits of hell because the bulls have full Fed and feds support.
That said, here are the signs the market is ready to turn:
Ultimate irrationality and panic buying abound
Most of today’s investors are too young to even know what a bear market feels like, and the retail crowd that is pushing indices beyond the walls at the top of the nose-bleed section on the backs of only half a dozen successful stocks is particularly young and inexperienced with reality. Call the only stocks leading the charge the Dazzling Demi-Dozen (they’ll be the Dirty Demi-Dozen when this thing breaks) because they are largely owned and run by the Trillion-Dollar Dozen I wrote about in August.
You can see the market’s moves into its own extremes are stretching what are referred to as its Bollinger Bands, more than ever before, and it is only those stocks pushing through that membrane:
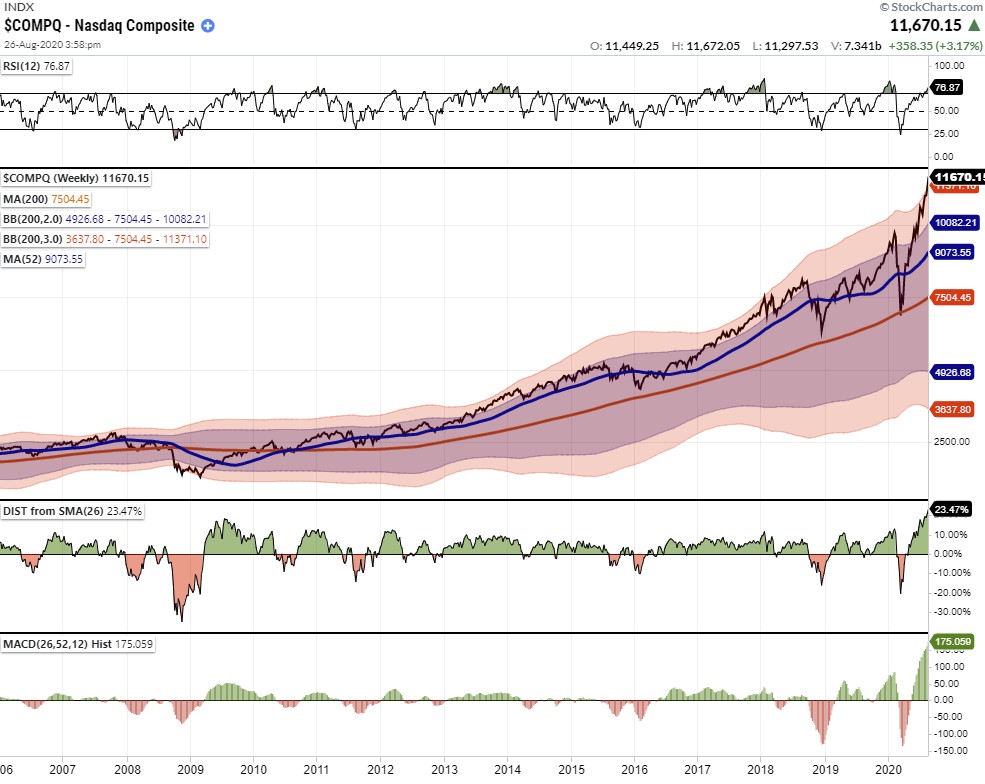
You can just as easily see that the NASDAQ has never remained in that pink zone of the upper limits for long before falling back down to, at least, touch the purple zone or to return to its moving average. In fact, this is the first time it has actually broken out of that upper band shown by the pink zone. So, the market is in a no-man’s zone now and more poised than ever before to fall harder than ever before.
As Lance Roberts notes,
Like a rubber band that has been stretched too far – it must be relaxed in order to be stretched again. This is exactly the same for stock prices that are anchored to their moving averages. Trends that get overextended in one direction, or another, always return to their long-term average. Even during a strong uptrend or strong downtrend, prices often move back (revert) to a long-term moving average.
The market is giving off plenty of other signs that it is ready to make that turn.
Panic buying:
The very top is usually marked by panic buying, and panic buying has certainly set in:
The panic buying we’re seeing in $TSLA and $AAPL today, following the historic runs into the stock splits effective today, firms my view that we are setting up for something sinister in markets…. Tony Dwyer suspended all efforts to give price targets, in essence acknowledging that traditional valuations metrics no longer apply:
Excess anyone?
None of these companies have produced results that justify these historic market cap expansions in such a short period of time, but they provide cover for the illusion that the bear market is over and that a new bull market has begun.
So let’s all acknowledge that sentiment is vastly bullish and people are piling into select stocks with no regard to risk…. It is hence notable that $SPX is coming into the end of August and beginning of September approaching historic resistance.
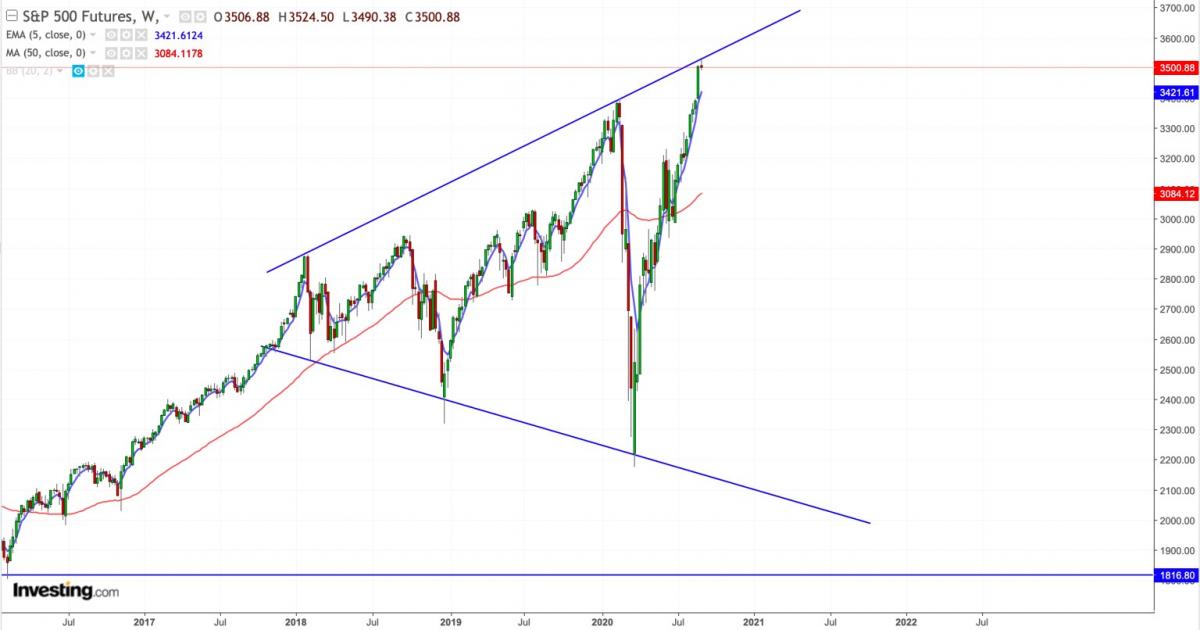
Based on recent past patterns for this so-called bull market, the above graph looks like the market is perched on the stadium wall with a long way to fall to the receding ground elevation below.
Who knows if history is still any guide in these times. If it is then the panic buying and optimism of these days is laying the groundwork for the tears that are to follow.
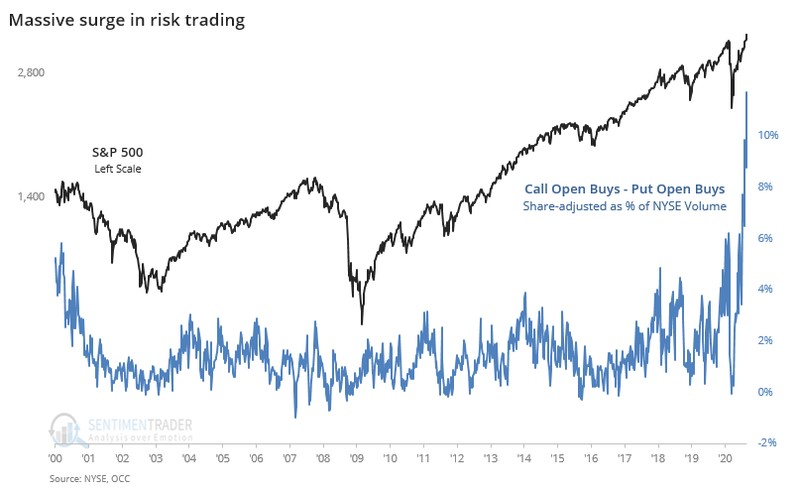
Buying panic shows itself in uberleverage, too:
Investors are literally using massive leverage to wager on imminent momentum moves such as those often highlighted OTM calls traded in Tesla stock…. Speculative options trading has now reached the equivalent of 12% of NYSE volume last week, far surpassing anything seen during either the dot com or housing bubbles. As [one investment analyst] summarizes, it’s “like some combustible combo of musical chairs, Russian roulette, and five finger fillet.”
Of course, all of this is happening even as the economy has begun to sink again into a rising sea of job losses; but that kind of action is precisely the look of ultimate irrationality before major stock-market breakdowns.
More signs the market may be about to run over a cliff
Since irrationality, even as the sign of a market peak, can continue longer than one’s solvency can remain if they are waiting it out, let’s look to other signs that indicate the market is nearing another major downfall.
Volatility is rebounding:
According to Goldman, the S&P’s new highs in February were the first such days in which the VIX closed above 15 since 2015. Six months later, the SPX is back at new all-time highs, and this time the VIX is in the 20’s – the highest VIX level at a new SPX high since Mar-2000. As Goldman’s Rocky Fishman says “this … can reflect growing uneasiness about SPX valuations (in addition to virus-related risk.”
Notice that past correlations between S&P highs and this level of market volatility have come anywhere from zero days before a market drop to 45 days:
Traders are chasing momentum like never before, but that has always made them spectacularly right UNTIL they were spectacularly wrong. It always happens approaching the summit, and this time is the craziest ever:
“This might be the weirdest market I’ve ever seen,” Goepfert said, adding he’s seen market oddities for weeks, and so far “they haven’t mattered.”
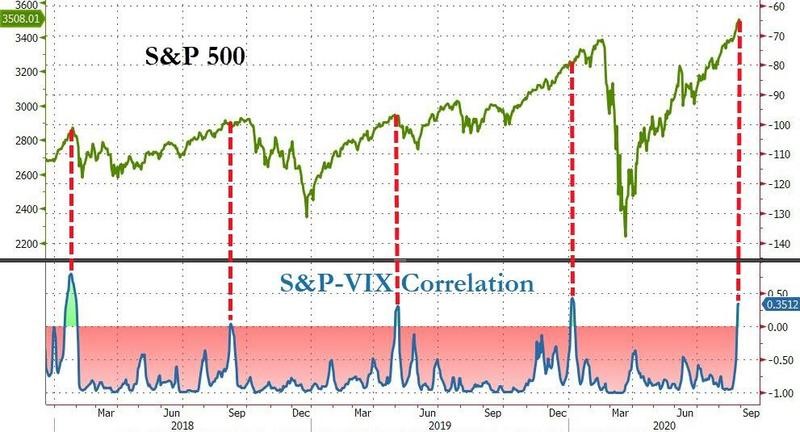
Volatility has snapped positive in a way that indicates extraordinary panic buying:
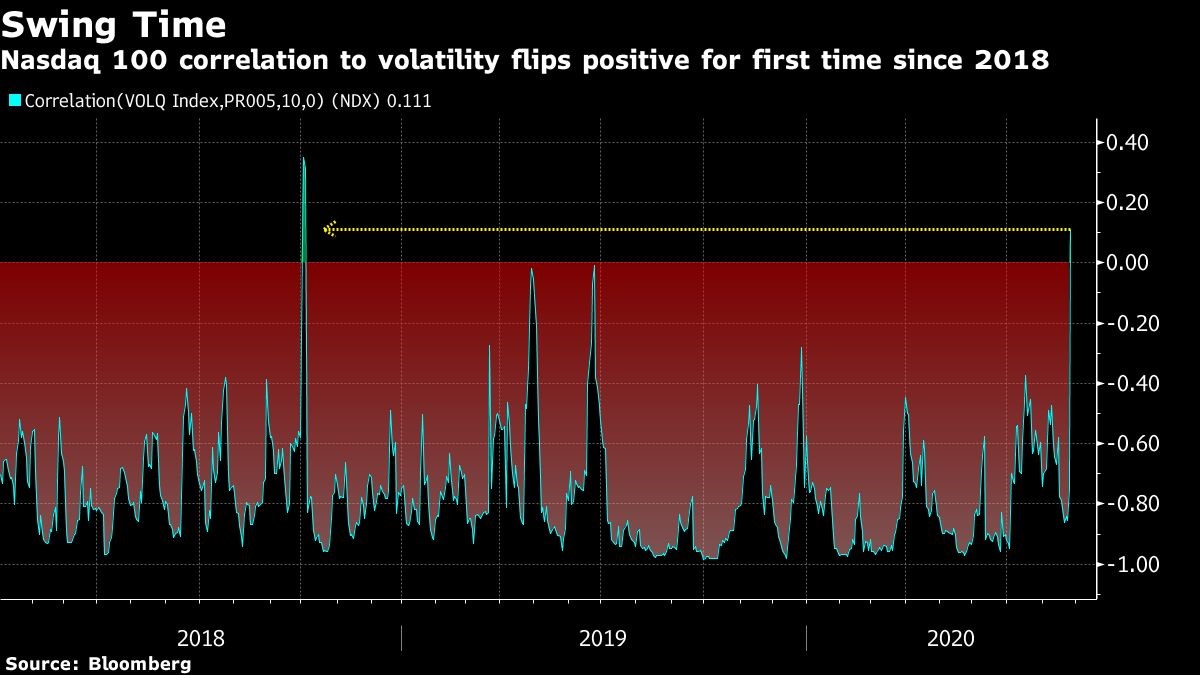
The author of the popular Felder Report financial blog said that typically the stock market and expected volatility — indicated by the VIX index — should move in opposite directions. Any divergence from this, which Felder said has now appeared, can signal “an impending reversal.”
Well, that snap to instantly moving in the same positive direction is a massive reversal that just flashed on the stock-market warning-gauge cluster.
Here is how far the S&P alone is valued above the total economy as a result of this stretching:
Extreme sentiment: (greed)
One expression of extreme sentiment is called market “gamma.” As you can see, it has risen to a point associated with market plunges:
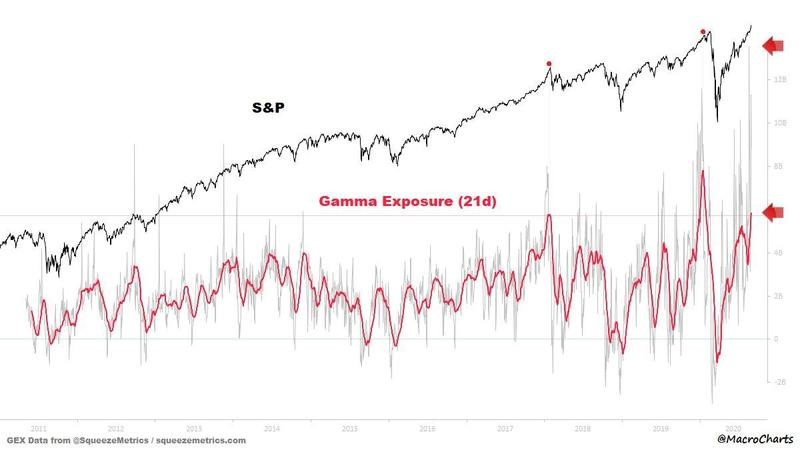
Entering the extreme zone, exceeded only once in the last decade, which was when the market crashed earlier this year.
Williams Market Analytics puts out a market sentiment (a.k.a. now “market mania”) indicator that looks like this:
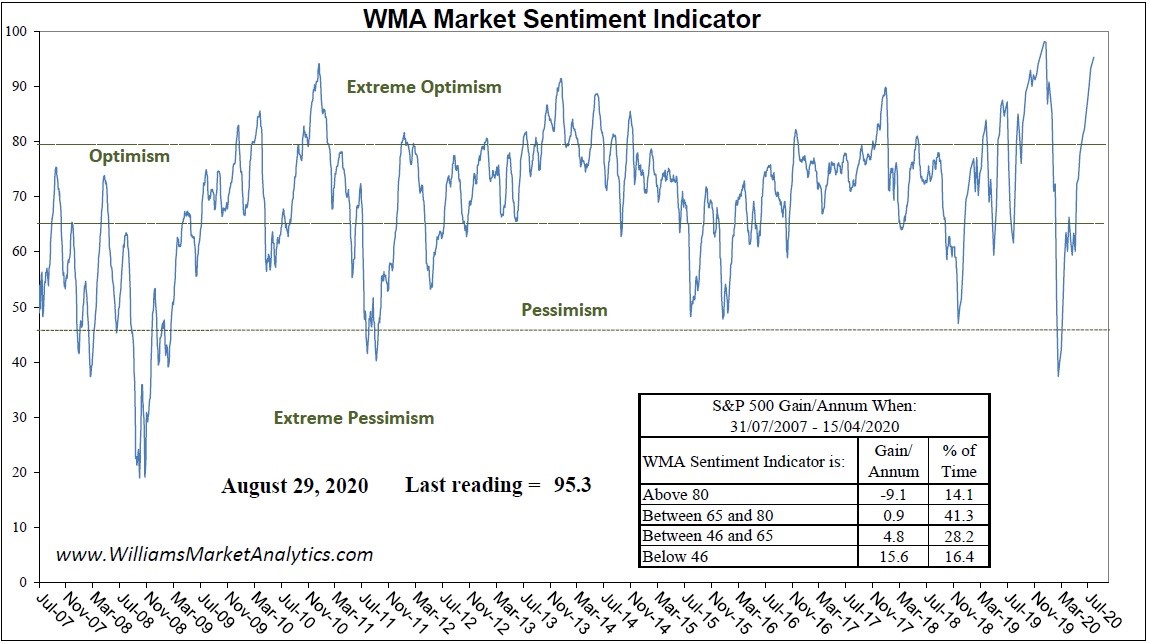
Also in the upper reaches of extremism.
Citigroup’s sentiment meter looks like this:
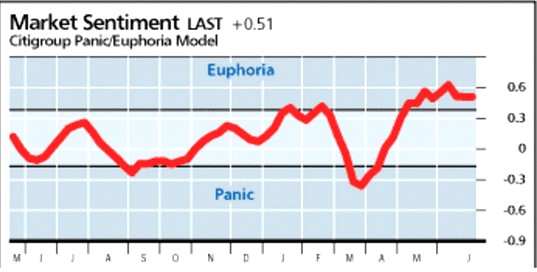
They’re all saying the same thing.
The only time sentiment has ever been this insane was when I was writing about how insane and precarious the market was last January just before the market crashed.
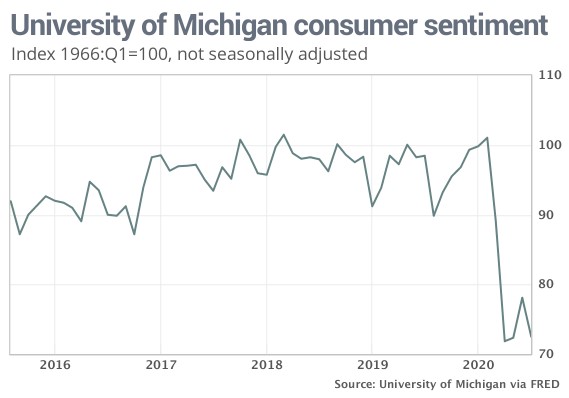
That’s market sentiment. Consumer sentiment out in the real economy, on the other hand, still looks like this:
Everyone on the same, same side:
One other sign of potentially spine-tingling rapid market failure is when everyone is trading on the same side of the cliff:
Those are still signs associated with market mania, showing momentum trade that is in one of its most extreme final melt-ups ever. Get ready for a stunning fall.
The fall has already begun
It only depends on where you look. So, let’s look at it from a slightly different point of view — not the top but the underside.
Rising/declining stocks:
Unfortunately, the correction in much of the market has already started. The number of stocks above their 50-day moving average in the NASDAQ 100 has declined sharply, despite the index surging to new highs. As of August 21, the number of stocks above their day moving average is around 68%…. The divergence between the number of stocks above that average and the NASDAQ 100 index is now at the widest point.
In other words, it is not just that some high-flying stocks are carrying all the load, but 32% of stocks in the NASDAQ have already fallen below their 50-day moving average. A lot of dead weight is hanging out the bottom, which those balloon stocks have to carry to keep the average rising.
It is not as those stocks they to fall for the others to rise. They are falling be most stocks really have no reason to rise. This divergence in patterns, as the writer quoted above says, is a brewing market storm.
Narrowing of market breadth within an index is a sign that markets are beginning to fade … and badly … knocking out stock after stock. Markets all over the world are doing the same thing right now as fatigue sets in.
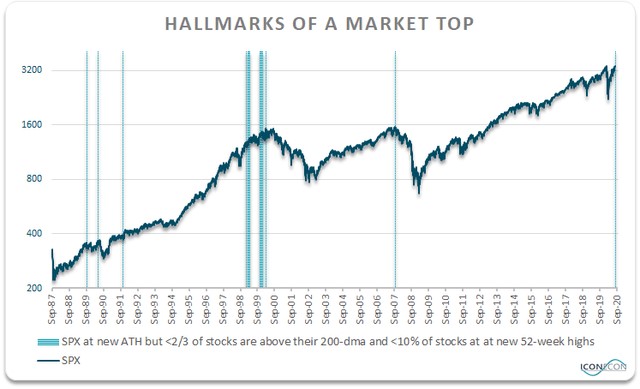
Other times when market internals looked similarly this divergent and poor are graphed with the bluish bars below:
Flightiness of the rally:
This is no one’s official metric of a market, fall, but look at the superficiality of this rally. Some may see it as the market’s incredible strength. I see it as the market’s emptiness of all reality. The market is soaring on ditzy hope like no market in history.
How much time did it take for the S&P 500 to fully recover from its massive February-March fall compared to other major market recoveries:
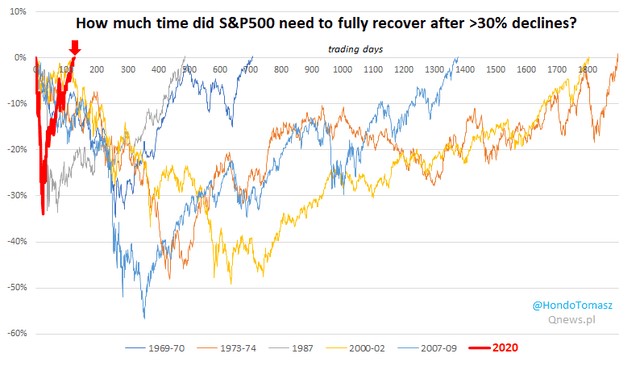
Those other recoveries happened slowly as the economy recovered. In this stock-market rally — the fastest on record — the economy only partially recovered during “reopening” and is now showing the very signs I said it would start to show, mid-July, of sliding back downhill. The market recovered in a sharp “V” based on the narrative that reopening would bring a V-shaped recovery to the economy, but that didn’t happen, leaving the market now more grossly out of touch with the economy than ever before and therefore more unsupported and dependent on the Fed than ever before. It has no reality to fly on but Fed fumes.
So, does a the world’s fastest stock recovery, set against what looks to be more like another Great Depression, really look like a robust stock recovery that is likely to hold for long or like a wet pipe dream about to burst?
If it’s all running on Fed fumes, let’s look at the one Fed-fueled factor that is almost single-handedly responsible delivering Fed fuel to the last decade-long bull market:
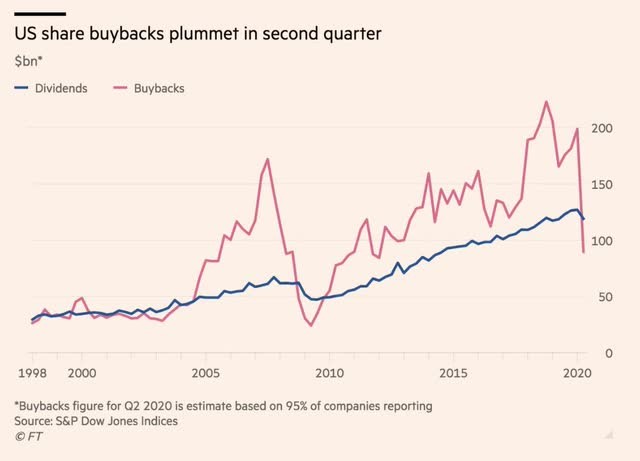
The Fed’s free funds financed record stock buybacks for years and years that lifted the market from the nape of its neck. Apparently not any more. Now the Fed is just making up lost income too keep companies alive!
Knowing stock buybacks burned the Fed’s free fuel to transport the market to higher levels all along its flight path over the cliffs, one ought to be a little concerned that the backpack engines have smoldered out to the lowest burn they have shown since the Great Recession. Corporations are in belt-tightening mode now in the business world. Such conservation of energy for the long winter ahead is not conducive to the buyback spree that created the bull market.
During the spring and summer now, the market has been riding entirely on the backs of high-flying retail traders. Their ambitious stock purchases were largely funded by the federal government’s unemployment bonuses, now stopped by congress and then reinstated at half their former level by Trump.
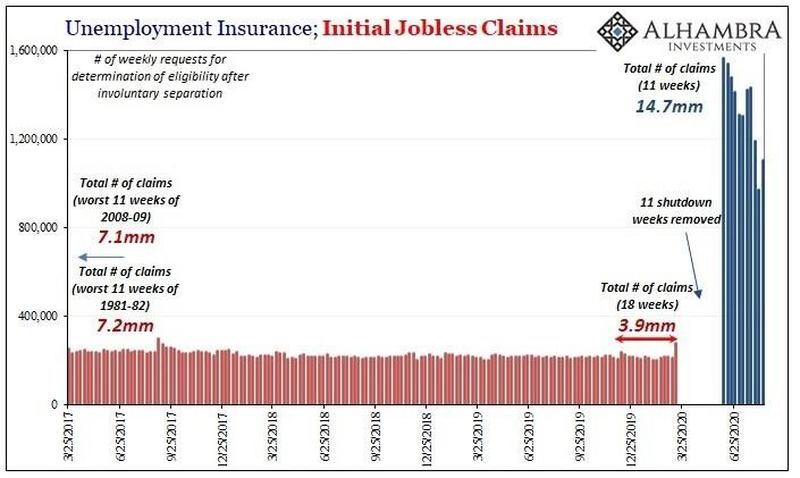
Meanwhile, economic bedrock during the reopening, looks like this:
(Here are the last eleven weeks of jobless claims during the great economic reopening (leaving out the far worse numbers during the economic lockdown). These are compared with the eleven WORST weeks from the Great Recession (notes and arrow) and with the last three years of normal jobless claims (red lines). As you can see, the jobless number is back to rising faster than a million a week!)
Or one can spread it out and show it this way to reveal that nothing is being hidden or exaggerated:
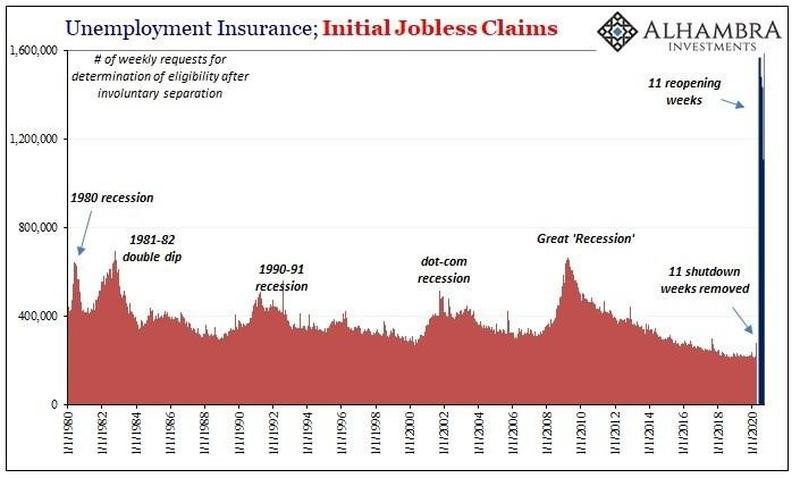
(Apparently new jobless claims are also up in the nosebleed section.)
This is recovery? And that is with TRILLIONS of Fed and federal funds being dumped into the economy, which are sparing us from feeling the affects of the greatest, quickest job losses probably in the history of the world, still running at over a million a week.
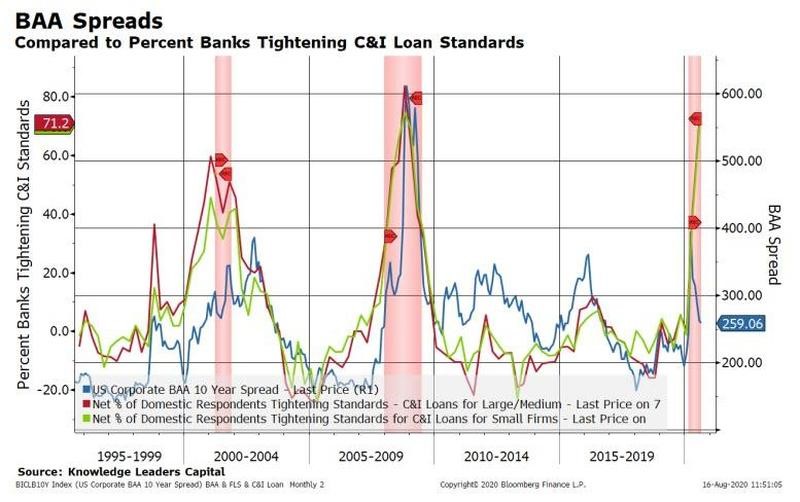
That’s now, but looking ahead: in spite of all the Fed easy money pumped into banks, banks have tightened commercial and industrial loans standards as much as they did during the last two recession:
In spite of the Federal Reserve reinflating bank reserve balances, banks have also raised their loan rates above their cost of funding as much as in previous recessions:
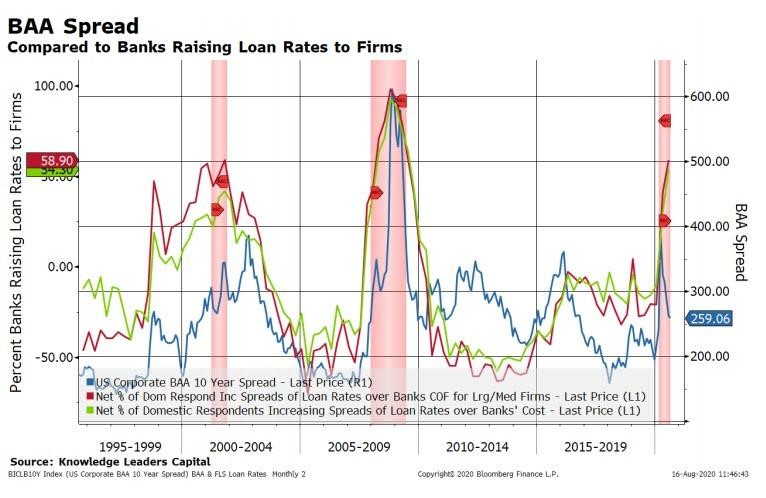
That doesn’t bode well for either stock buybacks (often financed by bank loans) or the general business climate in the months ahead.
Don’t just take my word for it
Investor who scored big in coronavirus rout … now says stock-market ‘environment presents … largest set of tail risks we’ve seen’ in 15 years. Jeffrey Talpins, the founder of Element Capital, says he’s betting against the market in the near term, the FT reports. “We believe that the rally has now extended well beyond levels justified by the state of the economy, and with little regard for the myriad of risk factors looming on the horizon.” That is Jeffrey Talpins, the founder of Element Capital, in an Aug. 18 letter to his clients, cited by the Financial Times (paywall), explaining his decision to reposition his $16 billion hedge fund for a potential downturn in the market after an unprecedented rebound in equities in the U.S. and Europe since March.
Talpins points to a congress that is increasingly stymied at passing relief packages and a stock market that is leaning far out past its ski tips. He notes the resurgence in million-plus job layoffs along with the resurgence in summer coronavirus cases and deaths in the US, and his bonafides are strong:
Element Capital, a macro-focused hedge fund, boasts average annual returns of 19% since it launched in 2005 without a down year, the FT notes.
The evidence above shows the bear has already broken out of his recovery cage. He is hunting on the market’s underside right now, picking off the buffalo calves one by one, but he’s about to rise up and chase the bulls off a cliff.
As in January, I cannot tell you exactly how long it will take for trader’s insane denial to run out of lofty energy. It may depend on when the market gets struck by the next black swan. However, there is more chaos brewing all over the world now — economically, socially, and politically, both domestically and internationally — than any time in my life. I think we all sense that, and black swans are born out of such troubled times. So, I think this market is “More Overpriced and Perilous Than Anytime in History,” and that includes the last time I wrote that!
*********

David Haggith started writing about the economy after he predicted The Great Recession half a year before it hit and was puzzled as to why no economists or stocks analysts saw it coming. In the months after the crisis broke out, he started to write humorous editorials in a series titled “Downtime,“ which chided the U.S. government and bankers who should have seen the economic collapse coming but whose cronyism, greed and ineptitude caused them to run the world into a ditch. Those articles were published in The Hudson Valley Business Journal, The Valley City Times-Record (North Dakota), and The Daily Herald in Tennessee. Haggith is dedicated to regularly criticizing the daily news — not just the content but the uncritical, unthinking nature of almost all of the reporting. He now writes his own blog, The Great Recession Blog, to break down the news as an equal-opportunity critic toward both Republicans and Democrats / Conservatives and Liberals … since neither kind of politician has done anything worthwhile to plot a better economic course. His articles are regularly carried by several economic websites.
More from Silver Phoenix 500


