Stock Market Cycle Top And Fearless VIX Signal Turning Point


Everything in the world goes through cycles including investors level of fear, and stock prices. In this report, I want to show you how you can identify short-term and longer-term market tops and bottoms using technical analysis that focuses on the most active time cycles in the stock market today.
Before we get into the details here I would like to touch on two myths that you as a trader need to know in terms of average profit per trade and the number of trades needed to be highly profitable. It's not what you may think. I’ll keep it short and to the point.
Myth #1: You Must Always Be In A Trade and Trading
You don’t need to trade every week, or need to always be in a position. This is a huge misconception and something that most traders struggle with grasping. The reality is, the fewer the trades you make less likely you are to lose money. For example, over the past 17 months, I have placed 53 trades which works out to only 3 trades a month, not many. With those 53 trades, our entire portfolio is up 74.9%. Ya, a whopping 75% with only a few simple trades a month and if you calculate what the average percent return is then you get a taste of trading reality, which brings us to the topic 2.
Myth #2: You Need 8%-25%+ Profit Per Trade to Made Big Profits
Average percent return per trade is another thing most traders have completely backward. If you take 74.9% divided by 53 trades you get 1.41% average return per trade. WOW, that’s low, right? Ya, it seems low, but that’s the reality of trading. The markets wiggle up and down 1-5% regularly and you cant perfectly nail every top or bottom, and sometimes a nice trend trade is completely wiped out in 1-3 days from a flash crash type of sell-off and we have seen a few of those in the past year. What you are left with is the safe middle 1%-3% each trade, and these trades are the norm. But with that said we still have some 5-10% losing trades, and some 20-45% winners pickled in there which is always exciting.
My point on these two topics is for you to stop thinking you always need to be trading and think every trade should make 10-20% profit or it's not worth your time and money.
I get emails about it all the time from traders who demand 5+ trades a week, expect big gains on every trade, and they usually have a story to share about how they recently lost a boatload money trading some 3X ETF with nearly their entire portfolio in one position and they need my help for some big trades to make it all back. Yes, I can help, Yes it's possible we get a couple of big trades that could do this, it happens, but we don't know exactly when or which trade it will be. We must put in our time, trade cautiously and the big wins will happen over time.
Traders like this most definitely need some help because if they don't start trading properly soon enough they will take a big loss, give back months/years of hard work, or blow up their account altogether. Trust me I have been there done that three times when starting out. Losing everything three times is a very sobering experience but sometimes it is the only way to learn if you don't find the right mentor or trading newsletter to follow. Focus on building your account and wealth over time, not in a few fast-moving stocks/ETF trades.
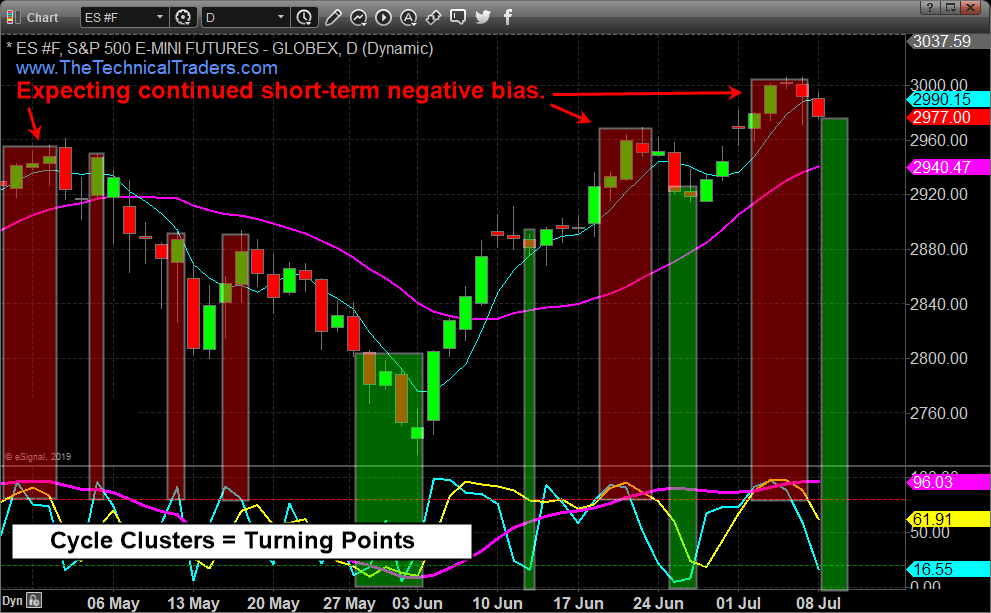
SP500 DAILY CHART & CYCLE ANALYSIS
This chart is a little cluttered but if you look at the bottom of the chart where my cycle tool is located you will see how different cycles have different strengths and form short term tops and bottoms.
They key focus should be on the three larger RED shaded areas, and the one large GREEN shaded area. Those are what I call Cycle Clusters. When all three cycles are in the overbought or oversold zone we should expect weakness for 3-6 days.
The light blue cycle when trading in the overbought or oversold zone can be used for re-entry or adding to positions in favor of the overall trend (up or down).
By having this technical trading tool we are able to scale in and out of the market for increased profits while reducing our portfolio risk.
This cycle tool is something subscribers to my Wealth Building Newsletter will have access to in the very near future including my complete entry, targets, and stop alerts.
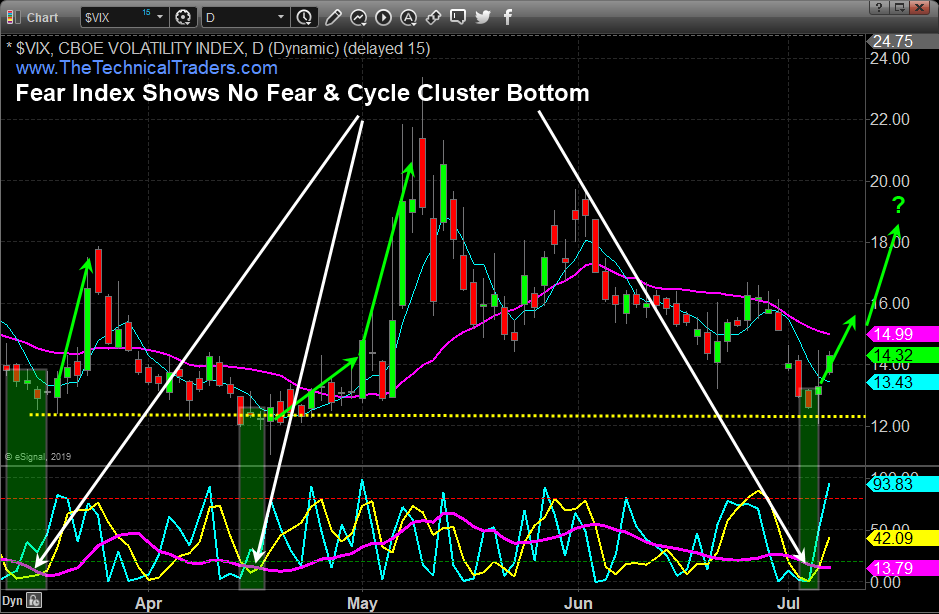
DAILY VIX CHART AT SUPPORT & CYCLE CLUSTER
I decided to pull some VIX analysis into this research simply because the VIX recently tagged a critical support level as shown on the chart below, along with a cycle low cluster. Both of these things occurring could mean stocks are set up for a deeper than normal correction in the very near future.
The VIX at times can act as a crystal ball during times of extreme fear or complacency. Currently, complacency is the signal with traders and investors having no fear of falling prices.
The VIX is a contrarian indicator with the old saying “When the VIX is high its time to buy, with the VIX is low its time to go”.
Based on the options market for VIX puts and calls traders are expecting the VIX rise over then a couple of days and even a month from now.
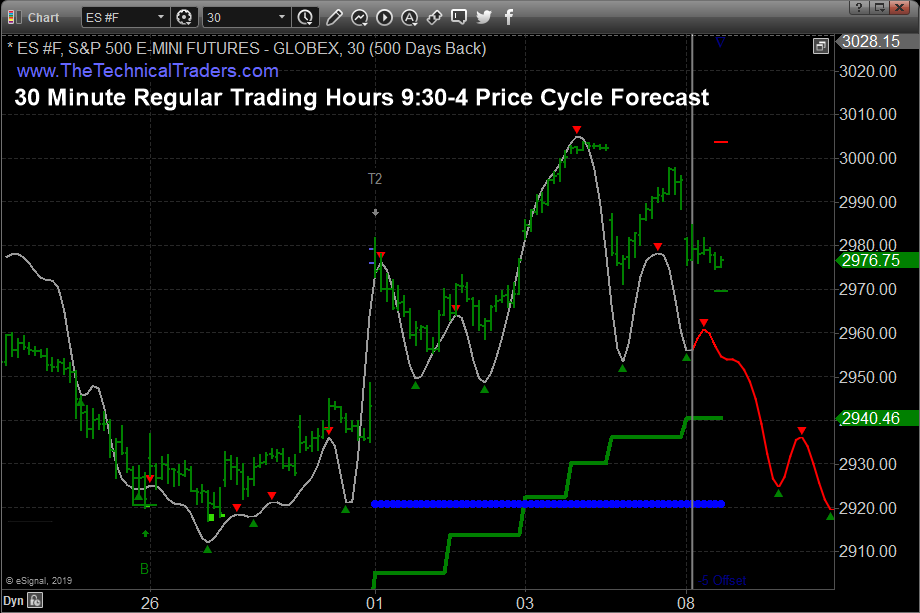
30 MINUTE CHART & CYCLE PREDICTION
If we take the analysis one step further, we can zero in on the 30-minute regular trading hours only chart (9:30 am ET – 4 pm ET) with our blended cycles price bias for a better feeling of where the price is wanting to go over the next 3-6 days.
Based on the SP500 index cycles, coupled with the VIX cycles and test of support the intraday analysis looking forward 3 days looks to be in line with the other trading tools.
FUN FACTS
FIFTEEN 5% WINNERS COMPOUNDED = 107% ROI
$500 PROFIT PER/MONTH = 30% ROI WITH $20K ANNUALLY
POSITION SIZING = TRADING SUCCESS
While there are hundreds technical indicators and thousands of ways to try and read, time, and trade the stock indexes I have developed my own way to spot stock index tops and bottoms using this special cycle tool. I should note that this works exceptionally well with gold, gold miners, silver, and oil.
IN CONCLUSION
In short, expect stocks to choppy sideways or lower this week and for the VIX to work is way higher.
We'll keep you informed as this plays out with Wealth Building & Global Financial Reset Newsletter if you like what I offer, join me with the 1 or 2-year subscription to lock in the lowest rate possible and ride my coattails as I navigate these financial market and build wealth while others lose nearly everything they own during the next financial crisis. Join Now and Get a Free 1oz Silver Round or Gold Bar Shipped To You!
I can tell you that huge moves are about to start unfolding not only in metals, or stocks but globally and some of these super cycles are going to last years. A gentleman by the name of Brad Matheny goes into great detail with his simple to understand charts and guide about this. His financial market research is one of a kind and a real eye-opener. 2020 Cycles – The Greatest Opportunity Of Your Lifetime
As a technical analysis and trader since 1997, I have been through a few bull/bear market cycles. I believe I have a good pulse on the market and timing key turning points for both short-term swing trading and long-term investment capital. The opportunities are massive/life-changing if handled properly.
*********

Chris Vermeulen has been involved in the markets since 1997 and is the founder of Technical Traders Ltd. He is an internationally recognized technical analyst, trader, and is the author of the book: 7 Steps to Win With Logic
Through years of research, trading and helping individual traders around the world. He learned that many traders have great trading ideas, but they lack one thing, they struggle to execute trades in a systematic way for consistent results. Chris helps educate traders with a three-hour video course that can change your trading results for the better.
His mission is to help his clients boost their trading performance while reducing market exposure and portfolio volatility.
He is a regular speaker on HoweStreet.com, and the FinancialSurvivorNetwork radio shows. Chris was also featured on the cover of AmalgaTrader Magazine, and contributes articles to several financial hubs like MoneyShow.com.
More from Silver Phoenix 500


