Stock Market Rally This Week?


We were expecting a drop this week to around 2647-63 SPX…and it surprised us by going all the way to 2628! Our call was then for a strong rally into the following week. Ideally, the next top should occur on Nov 2 as we tap the end of month/ early month seasonal money flows.
Last week saw some seriously crazy astro signatures with the Sun opposing Uranus on Tuesday, with the Sun then squaring the nodes of the full moon Wednesday that was in conjunction with Uranus in Taurus (2018-26). We also had some Jupiter/Saturn signature lows expected on Monday and then Friday with a Bradley turn signature squeezed into the mix on Wednesday (along with a FIB 21 calendar day turn from Oct 3).
Uranus continues its insanity next week with retrograde Venus opposing the planet on the 31st, but then we have the positive Mercury conjunct Jupiter on Monday the 29th following Sun conjunct Venus on the 26th. Let’s call it insanity in reverse with a huge rally coming.
The Sun opposing Uranus on the 23rd with retrograde Venus opposing Uranus on the 31st is pointing to a midpoint bottoming pattern between October 25 and 29. Venus retrograde, itself, has a midpoint due on the 27th.
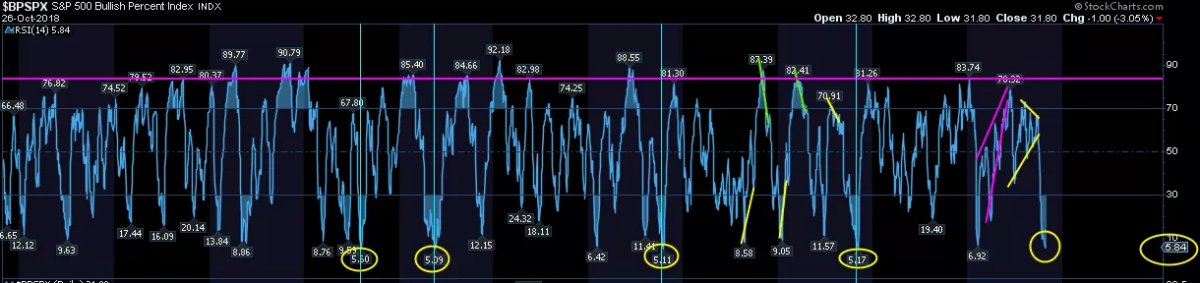
My e-wave read is that we just finished wave (x) of an wxy bearish B wave on Friday and (y) is about to rally in abc fashion into the Nov 2 expected top to my expected target of 2840 SPX. The $BPSPX (Bullish Percent) just reached a rare 5.84 low on the daily RSI. In the past, huge rallies follow: northmantrader.com
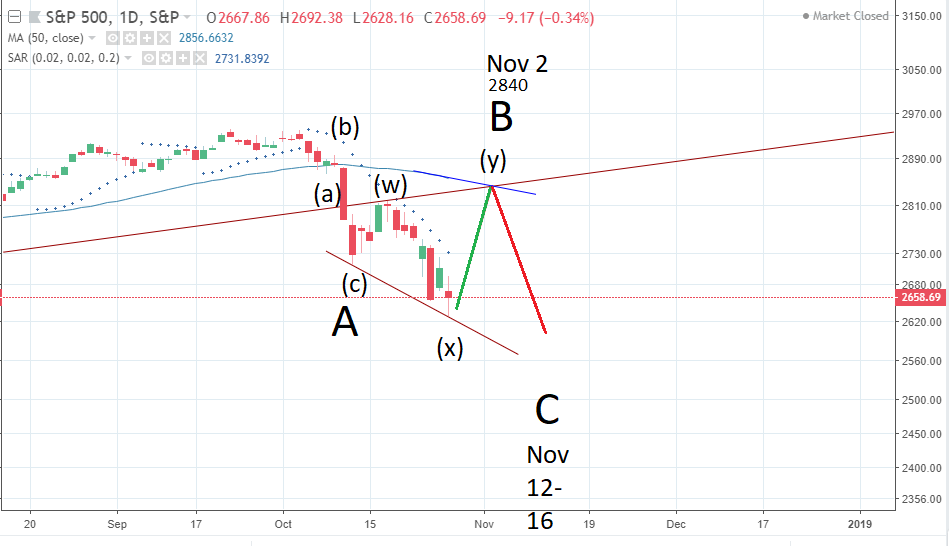
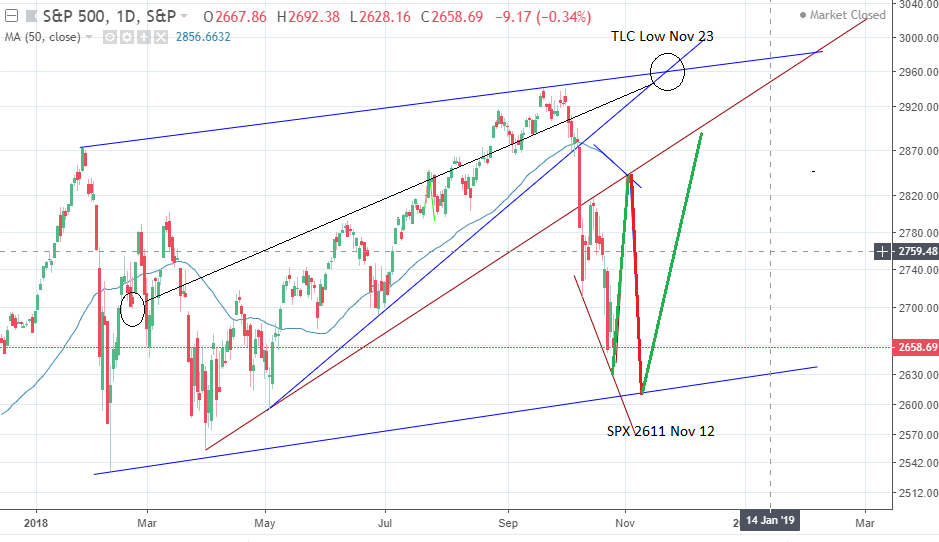
Often times in the past I’ve seen where large irregular (x) waves create (y) waves to travel double the distance of the previous (w) waves, in this case wave (w) was 106 points long. 2628 to 2840 is exactly 212 points long! The back kiss to the trend line broken happened with (w) and is expected with (y) of B too up to the 50 day moving average. The larger trend line break and snap back is seen in the chart below.
Also, the symmetry of the current pattern suggests an equal abc drop after Nov 2 into Nov 12 to 2611. This would count as an Elliott abc x abc pattern. I also have a TLC low due Nov 23, which should be a secondary or 8 TD low from Nov 12.
The recent cycle lows have been running a strange 11 TD count which is due next on the 12th of Nov. The ideal 20/40 week low is due on the 15/16th. The astro signatures for an important low are Venus Direct and Mercury Retro due on the 16th +/- 4 TD’s.
If I’m wrong about this scenario, I will see it in advance in early November as the pattern will shift. We do have the new moon on the 7th just the same as the Oct 8th bottom. Everything is lining up the same so far and the symmetry is perfect.
Below, I have the hourly wave counts of (x) along with the hourly MACD positive divergences:
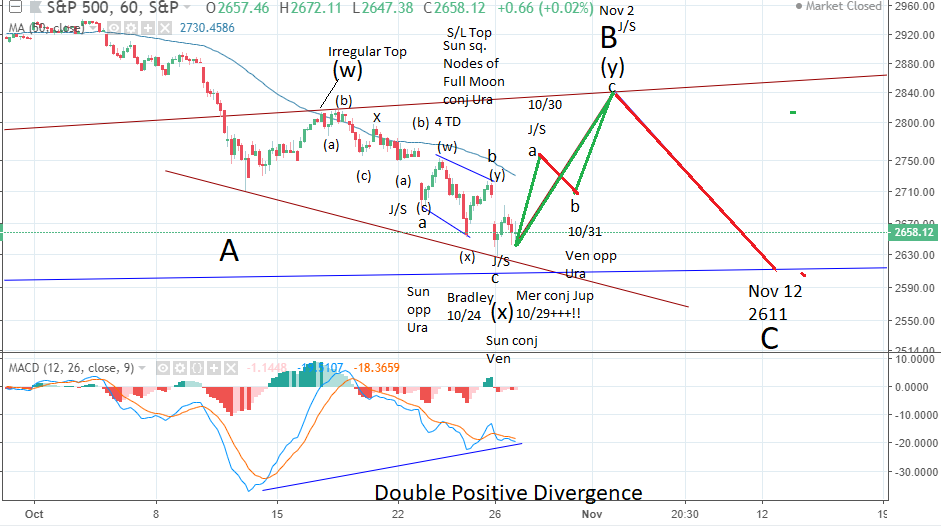
Note the irregular (b) wave top on the 17th (which was 16 TD’s +2). This suggested a return back with (y) above (w), which tagged 2816 on the 17th.
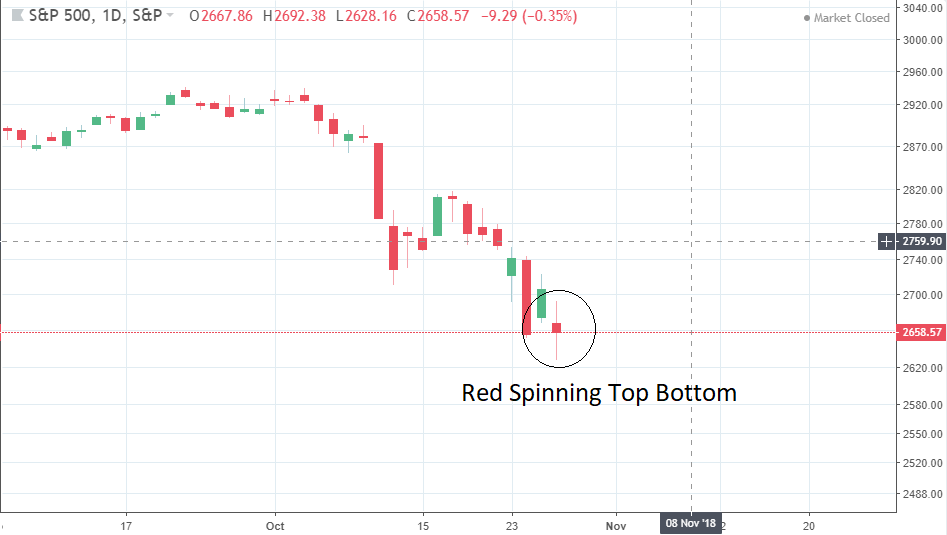
Below is a daily chart with the SPX showing a classic spinning top bottom (which is bullish!)
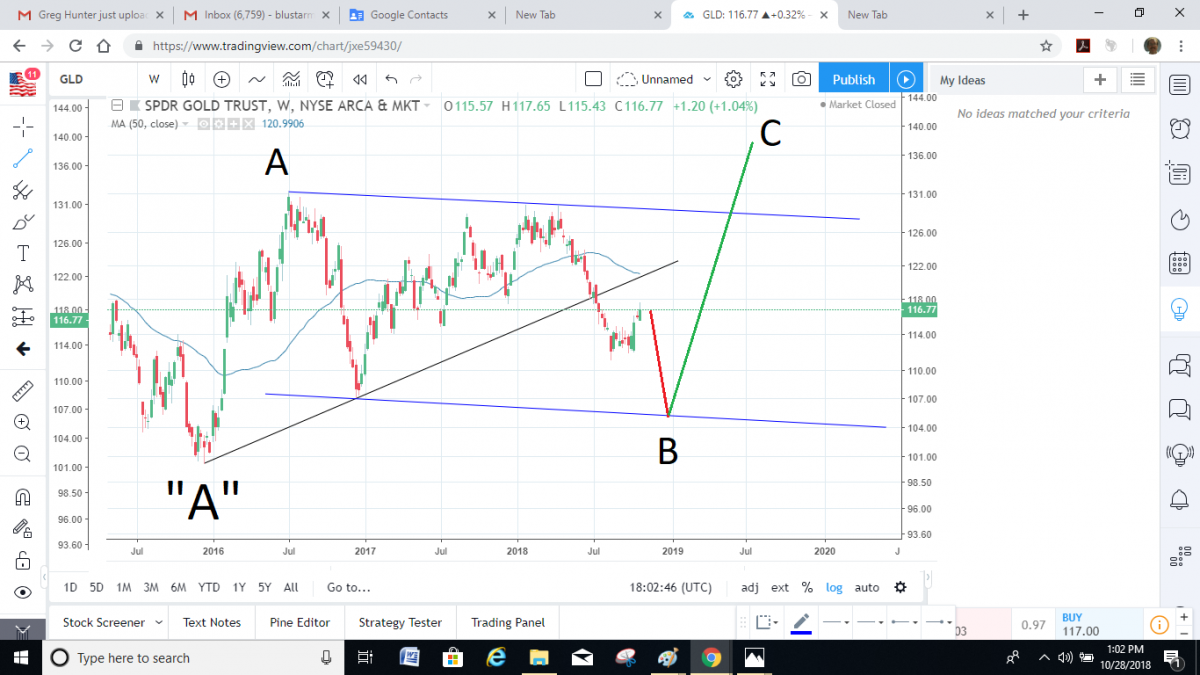
The weekly chart of GLD below shows a bullish B Wave flag pattern that is yet to complete to the down side (sorry bulls!). It makes sense since gold lately has been bottoming in December (due no doubt to tax losses, wow gold miners selling off with gold price ( ) reaching higher highs recently!). The good news for bulls is once we have seen a nice completion of the expected bullish flag, the pattern suggests a huge C Wave move up into 2019 much like what we saw in 2015/2016. The bad news is this is a bear rally with C due to finish around Dec 2023 (along with a near bottom in the stock market, the expected depression crash).
Overall, I believe we could see some more weakness for the stock the market from December 2018 into January 2019, at least this is what the gold market is hinting. Next year I see a rally back above 3000 on the SPX but a bear is coming, a genuine bear. SPX 2417 is still on my radar, the August 21, 2017 eclipse low which lead to that huge move up to 2872 in January 2018. If we don’t see 2417 by January 2019, we most certainly could see it by January 2020.
This expected sideways market scenario since the top on January 26, 2018 would set up a huge bull flag, which would propel us much higher into the year 2021 (sorry bears!). There is so much doom and gloom out there, which I think is coming, but not yet. Chicken Little will get it right eventually, but by that time the public will have been sucked in saying, “we have been missing it all along because we listened to the gloom and doomers for years and they have been wrong”.
We need to see that last mania phase where the public participates and we haven’t seen that phase yet. The good news is, this likely scenario gives those who know what’s coming (a depression like crash) more time to prepare.
BluStar Market Timer is now taking on new clients. We have been overwhelmed.
*********
More from Silver Phoenix 500


