The Stock Market Week in Review


The stock market had a rocky week last week, ending on a down note. Early on, I expected a possible 40 point SPX down move from Monday into Tuesday. I also was looking for a possible top around Thursday. The SPX fell 24 points from Monday into Tuesday and then rallied into Wednesday. I sent a note to my subs that it was possible we could come back to the SPX 2073/76 zone later in the week.
Monday’s action gave us a possible VIX (Volatility Index) sell signal implying a possible major top was at hand. As it rallied back into Wednesday, the NASDAQ failed to follow, creating what is known as an inter-market bearish divergence (these usually last for about a week while the New York Market trends higher).
By Thursday, I had noted that a bearish rising wedge had formed on the hourly chart, implying a waterfall decline soon to come. I was beginning to think perhaps we would not break the rising wedge just yet (due to the NASDAQ divergence) and second guessed myself, thinking we would tag the gap at 2096 Friday and then rally into Monday. We were still short going into Friday’s down move, however, when we broke the hourly rising wedge.
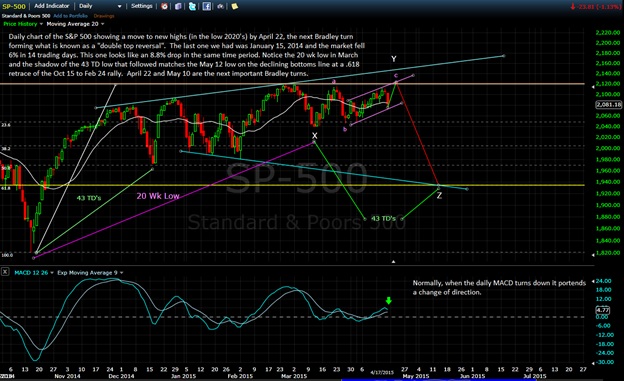
I recognized early on that the whole pattern shifted to a bullish x-y-z irregular flat pattern as the market fell hard. A note was sent out to my subs to cover shorts, and to accumulate longs starting at 2078 down to 2073 SPX. The market had finally showed its hand! It is likely going up to challenge the SPX 2119 area by mid week next week, creating a “Double Top”! Double Top Reversals are notorious for quick reversals that drop in a matter of days. The last such reversal occurred on Jan 15, 2014, lasting 14 trading days into Feb 5, dropping 6%. Following the same pattern, this would put the bottom of Wave Z on May 12th (see charts below).
May 12th is 43 trading days from the last 20 week low on Mar 11. The previous 20 week low was on Oct 15, 2014. 43 trading days later was the terminus of the 5% drop from Dec 5-16, 2014, creating a possible shadow low ahead that has been on my radar for a while now.
Normally, coming off this kind of drop (also from a Rising Wedge), you might expect a strong snap back rally to new highs, but I don’t think that will happen this time as the cycles hopscotch into the May 22 and June 8 expected lows (like we saw in January into early February). This, itself, is odd behavior, but the market has been less than stellar when it comes to normal behavior lately.
Many analysts are now convinced we are seeing the beginning of the long awaited correction or bear market. The daily MACD has turned down, the VIX has given a sell signal, the Transports continue to decline and the Utilities continue their sell-off. These are definitely signs of a coming bear market, but the market rarely accommodates the majority view, at least not in a timely manner.
Many of my colleagues have been continually frustrated by the inability to properly read the market lately. I have to admit, it has been the toughest market for me to read in over 30 years of watching it gyrate up and down. Right now, Elliott Wave is giving me the biggest advantage as x-y-z patterns like the recent one always lead higher. Also, markets don’t usually fall this fast off of highs like this if they were truly going down like many expect.
Here are the chart projections going forward. I think I finally figured out what the market is doing in the short term. If we rally to new highs by Wednesday next week on the SPX, the likelihood increases dramatically that this is the top everyone is looking for.
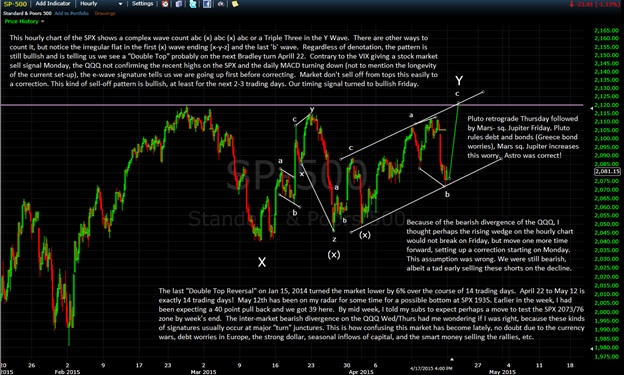
The daily chart above showing a move to 1935 SPX by May 12th was posited by me back on April 2, 2015 as a possibility. Now I believe that possibility increases. A note on last week’s astro: Pluto turned retrograde on Thursday and Pluto rules debt and bonds. The next day (Mars sq. Jupiter is an exaggerating influence especially with oil.. did you notice gas prices went up about 7% overnight?) on Friday, Greece came into the spotlight due to the IMF announcing that it would not allow Greece to extend its debt payments of its massive bailout. The US market plunged by about 39 SPX points, close to the 40 I was expecting!
Next week, we have a strong Bradley turn due on April 22 and Mars trine Pluto. From my understanding, trines usually indicate tops. The next reversal period is not due until May 1, where the day before (April 30) should be a minor low of the first wave (a) down (just under 2000?). The next Bradley is due on May 10, then the 26th and finally June 9 (the skipping lows I’m expecting down to SPX 1924). I have a trend line convergence (TLC) low due on the NASDAQ around May 8th and again on the SPX May 22.
Of note, the precious metals have been declining while the mining stocks have been rallying some. There is the look that both will rally strongly after the stock market tops next week. The same thing happened back in January 2014 into March of that year (and the astro looks to favor them too). Keep in mind that the expected precious metals rally will be in the context of a bear market rally. We are in danger of deflation right now, not inflation. This general trend is likely to continue into early 2017, IMHO.
As soon as I can get some rest from trying to figure out what the market is doing in the short-term, I’m going to concentrate on trying to figure out what may happen past June, even into the years generally up to the year 2020, where a major crash low is due and perhaps the start (or near start) of WWIII.
********
The BluStar Market Timer was rated #1 in the world by Timer Trac in 2014 (and from April 1, 2014 through March 31, 2015), competing with over 1600 market timers. This occurred despite what the author considered to be (and still considers to be) a very difficult trading environment. Brad Gudgeon, editor and author of the BluStar Market Timer, is a market veteran of over 30 years. The subscription website is www.blustarmarkettimer.info To view the details more clearly, you may visit our free chart look at www.blustarcharts.weebly.com This web site is also updated periodically as events unfold.
Copyright 2015 BluStar Market Timer. All Rights Reserved.
Disclaimer: The information provided by the BluStar Market Timer is to be used for educational purposes only. We do not recommend the buying or selling of any securities, are not registered investment advisers and do not offer investment advice. Stock market investing is considered risky. Market timers can and do make mistakes. Past performance is never a guarantee of future performance.
More from Silver Phoenix 500


