Stocks Extended Their Short-Term Downtrend…But Will They Continue Lower?


In our opinion, no speculative positions are justified.
Our intraday outlook is neutral, and our short-term outlook is neutral. Our medium-term outlook remains bearish, as the S&P500 index extends its lower highs, lower lows sequence:
Intraday outlook (next 24 hours): neutral
Short-term outlook (next 1-2 weeks): neutral
Medium-term outlook (next 1-3 months): bearish
Long-term outlook (next year): neutral
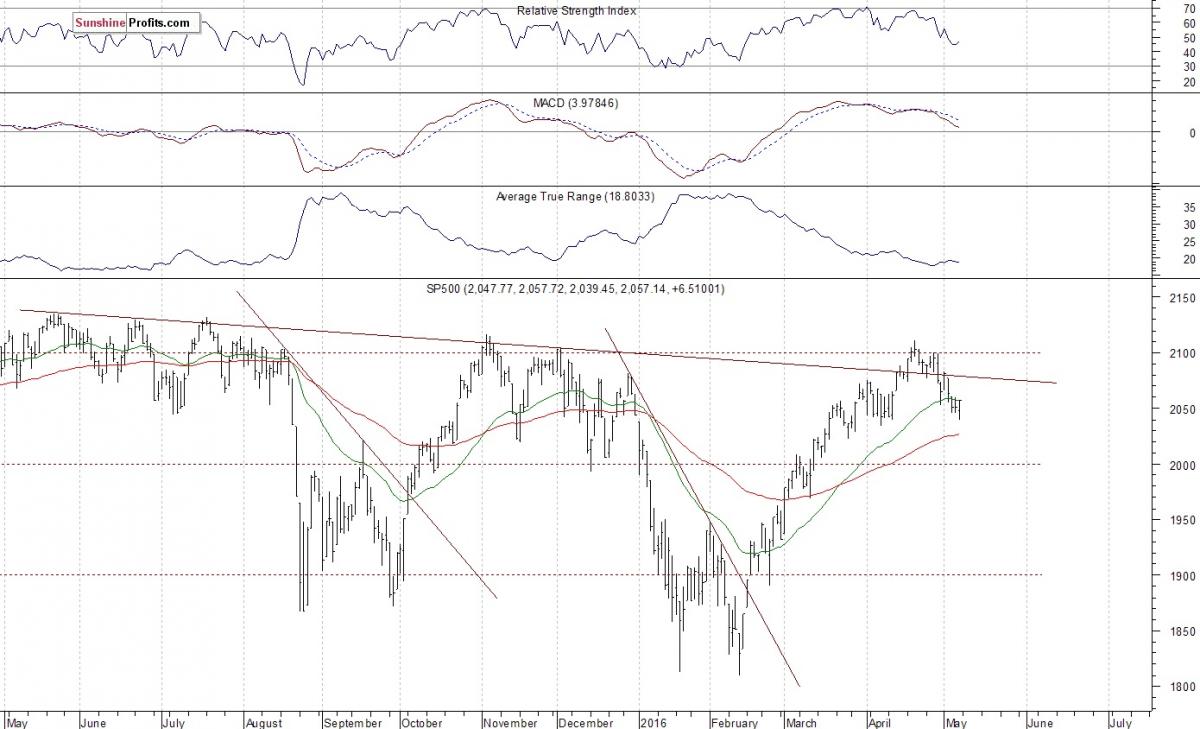
The U.S. stock market indexes gained 0.3-0.5% on Friday, retracing some of their recent move down, as investors reacted to Monthly Nonfarm Payrolls data release, among others. However, the S&P500 index has extended its short-term downtrend, before bouncing off support level at around 2,030-2,040. The nearest important level of resistance is at 2,060, marked by last week's consolidation. The next resistance level remains at 2,070-2,075, marked by the late April short-term consolidation. Is this the end of two-month long uptrend? Or is it just a correction before another leg up reaching last year's all-time high? Last year's highs along the level of 2,100 continue to act as medium-term resistance level, as we can see on the daily chart:
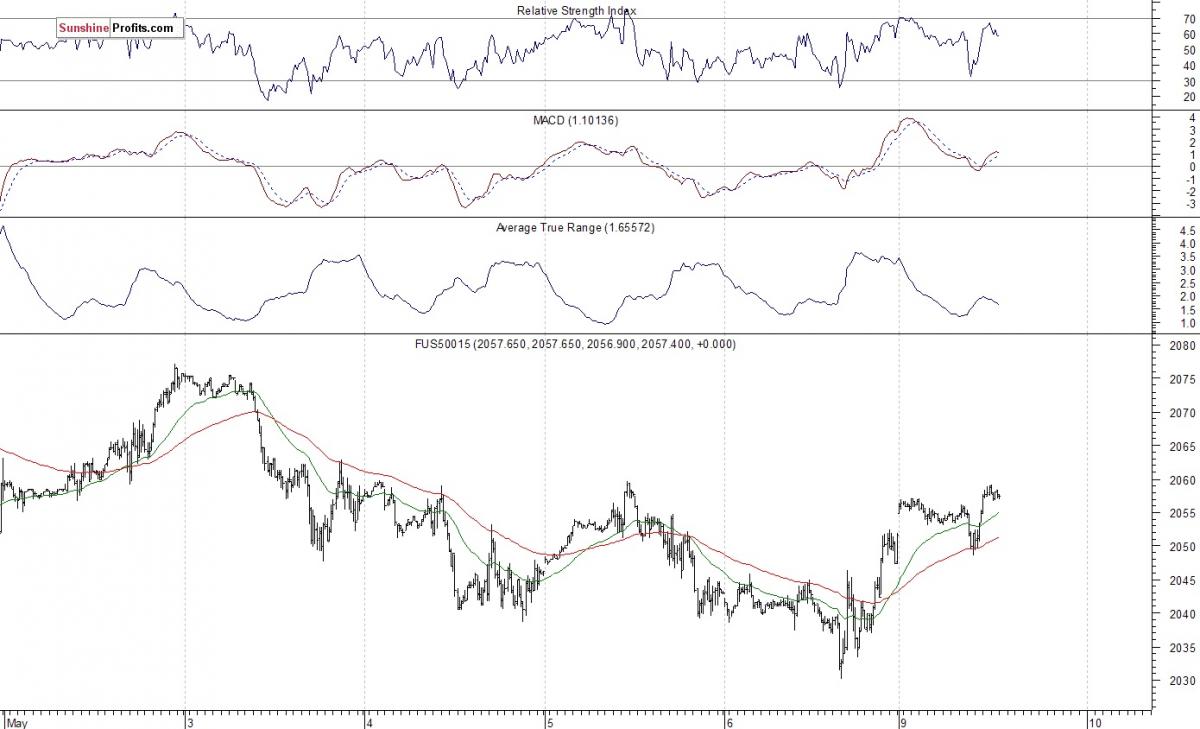
Expectations before the opening of today's trading session are positive, with index futures currently up 0.2-0.3%. The European stock market indexes have gained 0.5-1.9% so far. The S&P 500 futures contract trades within an intraday uptrend, as it gets closer to its level of resistance at 2,060, marked by recent local high. On the other hand, support level is at 2,030-2,040, marked by Friday's local low, among others. There have been no confirmed positive signals so far. However, we can see some short-term technical oversold conditions:
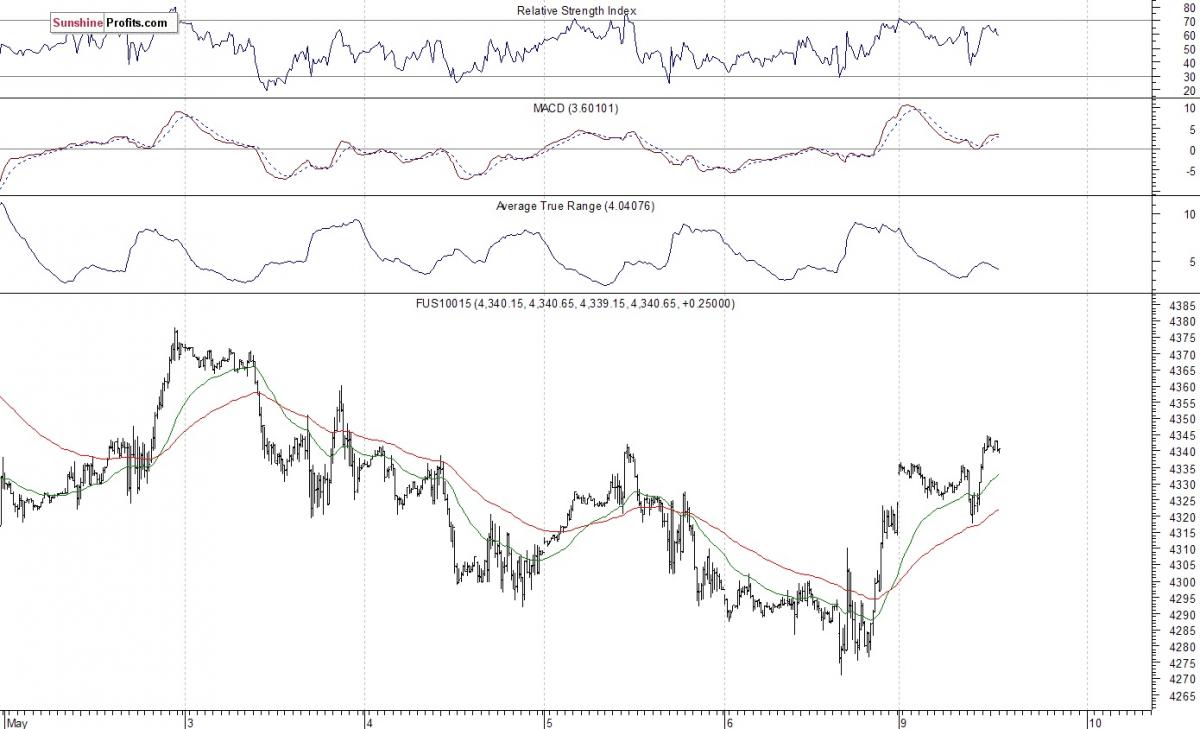
The technology Nasdaq 100 futures contract follows a similar path, as it extends its Friday's rebound off support level at around 4,270-4,300. On the other hand, the nearest important level of resistance is at 4,350-4,380, marked by some previous local highs. For now, it looks like an upward correction following recent downtrend:
Concluding, the broad stock market extended its short-term downtrend on Friday, before bouncing off support level, marked by the early April consolidation. The S&P 500 index remains relatively close to its last year's medium-term highs along the level of 2,100. Is this just a downward correction following over two-month long rally or new medium-term downtrend? The S&P 500 index continues to trade above its late March - early April local lows. It still looks like a downward correction, so we prefer to be out of the market, avoiding low risk/reward ratio trades. We will let you know when we think it is safe to get back in the market.
More from Silver Phoenix 500


