Stocks Fluctuate Along Record Highs - Topping Pattern Or Just Pause?


In our opinion, speculative short positions are favored (with stop-loss at 2,410, and profit target at 2,200, S&P 500 index).
Our intraday outlook is bearish, and our short-term outlook is bearish. Our medium-term outlook remains neutral, following S&P 500 index breakout above last year's all-time high:
Intraday outlook (next 24 hours): bearish
Short-term outlook (next 1-2 weeks): bearish
Medium-term outlook (next 1-3 months): neutral
Long-term outlook (next year): neutral
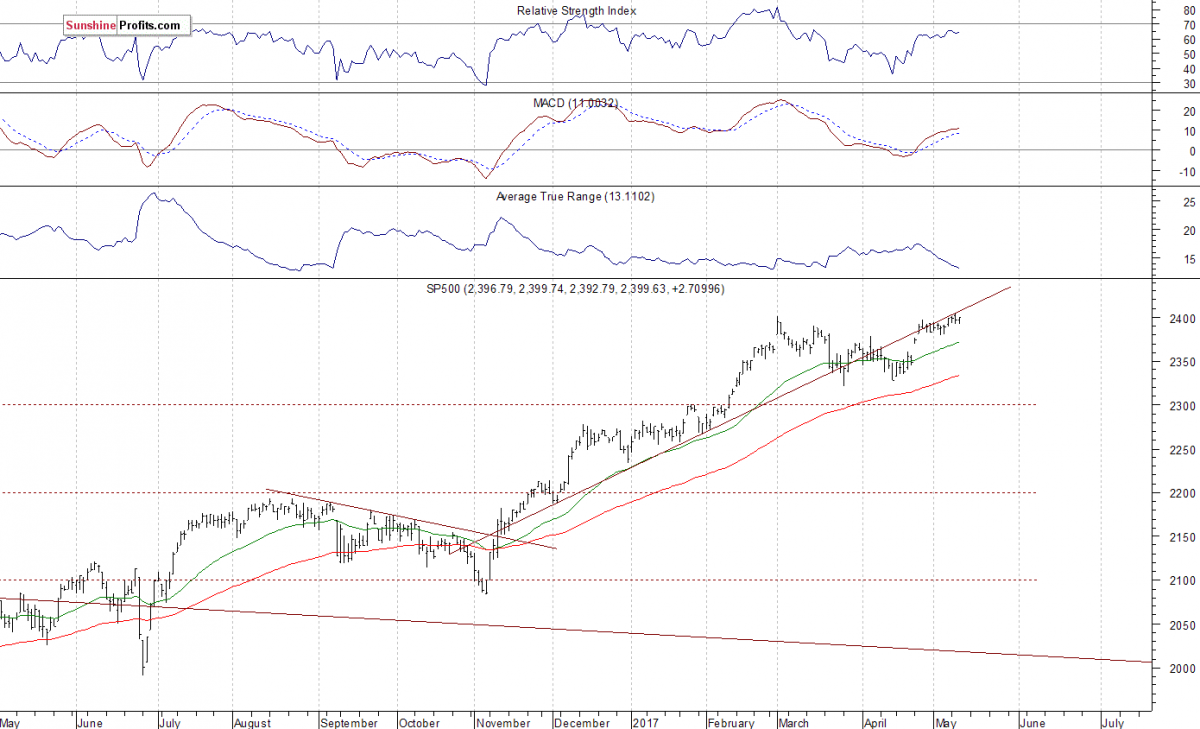
The main US stock market indexes were mixed between -0.2% and +0.1% on Wednesday, extending their short-term fluctuations, as investors took short-term profits off the table. The S&P 500 index remains close to its Tuesday's new all-time high at the level of 2,403.87. The index has broken slightly above the March 1 high on Tuesday, before closing lower by 0.1%. The Dow Jones Industrial Average remained below the level of 21,000, and the technology Nasdaq Composite index continued to trade above the level of 6,100. Will the broad stock market index continue its eight-year-long bull market? The nearest important level of support of the S&P 500 index is now at 2,390, marked by short-term local low. The next support level remains at 2,375-2,380, marked by the April 25 daily gap up of 2,376.98-2,381.15. The support level is also at 2,355-2,370, marked by the April 24 daily gap up. On the other hand, the nearest important level of resistance is at 2,400-2.405, marked by new record high, among others. We can see some volatility following six-month-long rally off last year's November low at around 2,100. Is this a topping pattern before medium-term downward reversal? The uptrend accelerated on March 1 and it looked like a blow-off top pattern accompanied by some buying frenzy. The S&P 500 index is currently trading along its medium-term upward trend line, as we can see on the daily chart:
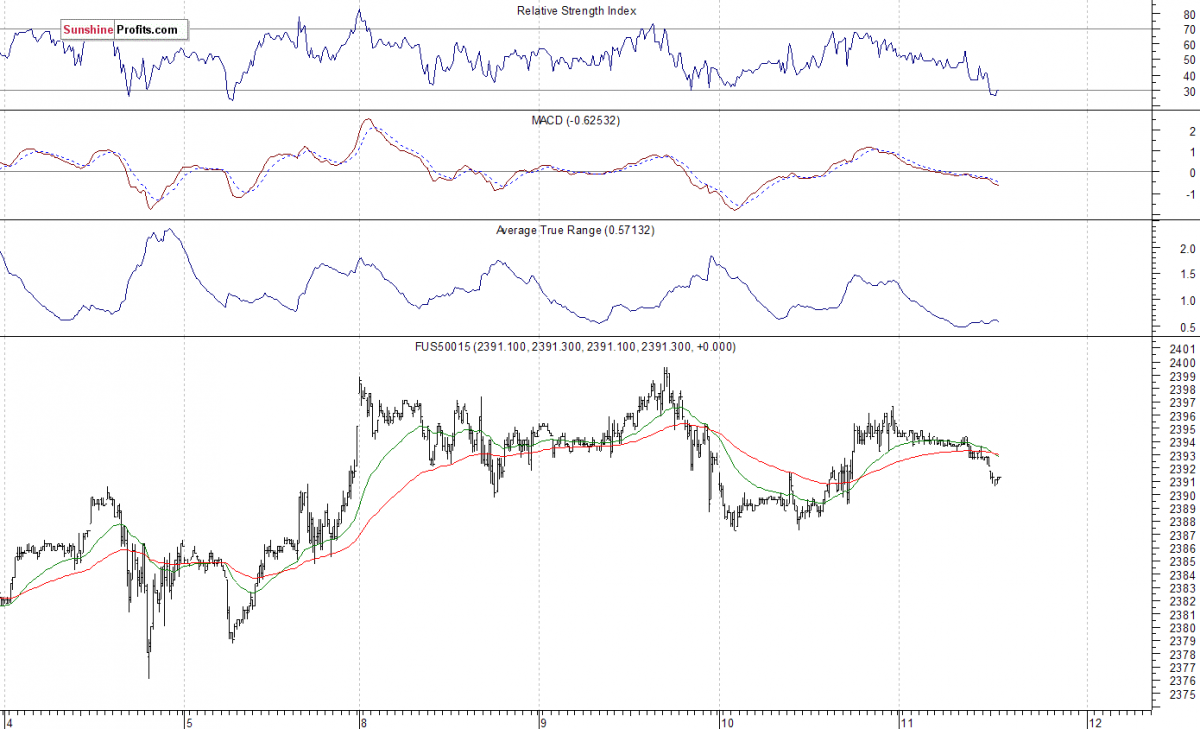
Expectations before the opening of today's trading session are slightly negative, with index futures currently down 0.1-0.2%, as the market extends its short-term consolidation. The main European stock market indexes have been mixed so far. Investors will now wait for some economic data announcements: Initial Claims, Producer Price Index, Core Producer Price Index at 8:30 a.m. The market expects that the Producer Price Index along with Core Producer Price Index grew 0.2% in April. The S&P 500 futures contract trades within an intraday downtrend, as it retraces some of its yesterday's late-session advance. The nearest important level of support is now at around 2,385-2,390, marked by previous local highs. The next support level remains at 2,375-2,380, marked by previous short-term local lows. The support level is also at 2,365, marked by previous consolidation. On the other hand, resistance level is at around 2,400-2,405, marked by March topping consolidation, and the new all-time high slightly above 2,400 mark. Will the market break above two-month long consolidation? Or is this just another upward correction? We can see some medium-term negative technical divergences, but will they lead to a downward correction?
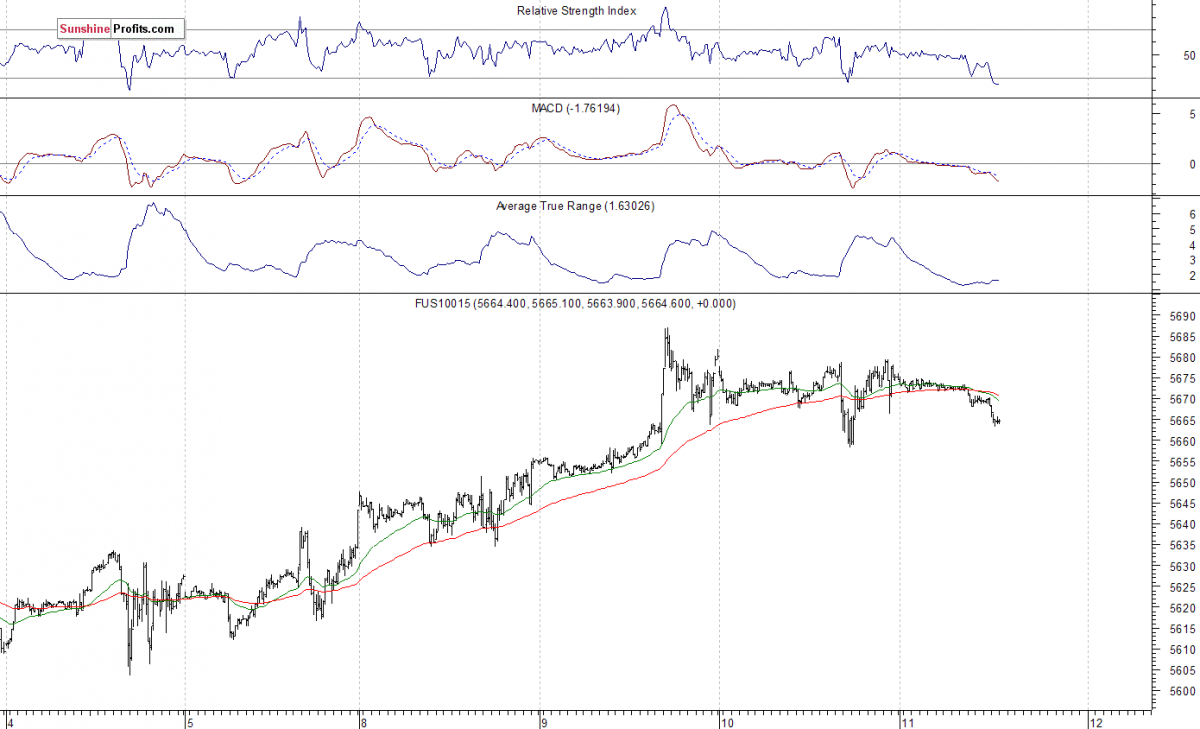
The technology Nasdaq 100 futures contract remains relatively stronger than the broad stock market, as it is currently trading just 0.4% below its Tuesday's new record high of around 5,690, following better-than-expected quarterly corporate earnings releases. The nearest important support level is at around 5,650, marked by previous resistance level. The next support level is at 5,630-5,640. The support level is also at 5,600, marked by previous short-term consolidation. On the other hand, level of resistance is at around 5.690-5,700. There have been no confirmed negative signals so far. However, we can see short-term overbought conditions:
Concluding, the S&P 500 index reached new all-time high at the level of 2,403.87 on Tuesday. However, it failed to continue short-term uptrend, as it gained just 0.1% on Wednesday. The broad stock market is still relatively weaker than the record-breaking technology Nasdaq Composite index. Will the broad stock market continue towards more new record highs? The index is currently trading along its six-month-long medium-term upward trend line. There have been no confirmed negative signals so far. However, we still can see medium-term negative technical divergences. Therefore, we continue to maintain our speculative short position (opened on February 15 at 2,335.58 - opening price of the S&P 500 index). Stop-loss level is at 2,410 and potential profit target is at 2,200 (S&P 500 index). You can trade S&P 500 index using futures contracts (S&P 500 futures contract - SP, E-mini S&P 500 futures contract - ES) or an ETF like the SPDR S&P 500 ETF - SPY. It is always important to set some exit price level in case some events cause the price to move in the unlikely direction. Having safety measures in place helps limit potential losses while letting the gains grow.
To summarize: short position in S&P 500 index is justified from the risk/reward perspective with the following entry prices, stop-loss orders and profit target price levels:
S&P 500 index - short position: profit target level: 2,200; stop-loss level: 2,410
S&P 500 futures contract (June) - short position: profit target level: 2,197; stop-loss level: 2,407
SPY ETF (SPDR S&P 500, not leveraged) - short position: profit target level: $220; stop-loss level: $241
SDS ETF (ProShares UltraShort S&P500, leveraged: -2x) - long position: profit target level: $15.47; stop-loss level: $12.98
Paul Rejczak
Stock Trading Strategist
* * * * *
Disclaimer
All essays, research and information found above represent analyses and opinions of Paul Rejczak and Sunshine Profits' associates only. As such, it may prove wrong and be a subject to change without notice. Opinions and analyses were based on data available to authors of respective essays at the time of writing. Although the information provided above is based on careful research and sources that are believed to be accurate, Paul Rejczak and his associates do not guarantee the accuracy or thoroughness of the data or information reported. The opinions published above are neither an offer nor a recommendation to purchase or sell any securities. Mr. Rejczak is not a Registered Securities Advisor. By reading Paul Rejczak’s reports you fully agree that he will not be held responsible or liable for any decisions you make regarding any information provided in these reports. Investing, trading and speculation in any financial markets may involve high risk of loss. Paul Rejczak, Sunshine Profits' employees and affiliates as well as members of their families may have a short or long position in any securities, including those mentioned in any of the reports or essays, and may make additional purchases and/or sales of those securities without notice.
More from Silver Phoenix 500


