Stocks Fluctuate Following Recent Decline - Bottom Or Just Pause Before Another Leg Down?


In our opinion, speculative short positions are favored (with stop-loss at 2,120, and profit target at 2,000, S&P500 index).
Our intraday outlook is bearish, and our short-term outlook is bearish. Our medium-term outlook remains bearish, as the S&P500 index extends its lower highs, lower lows sequence:
Intraday outlook (next 24 hours): bearish
Short-term outlook (next 1-2 weeks): bearish
Medium-term outlook (next 1-3 months): bearish
Long-term outlook (next year): neutral
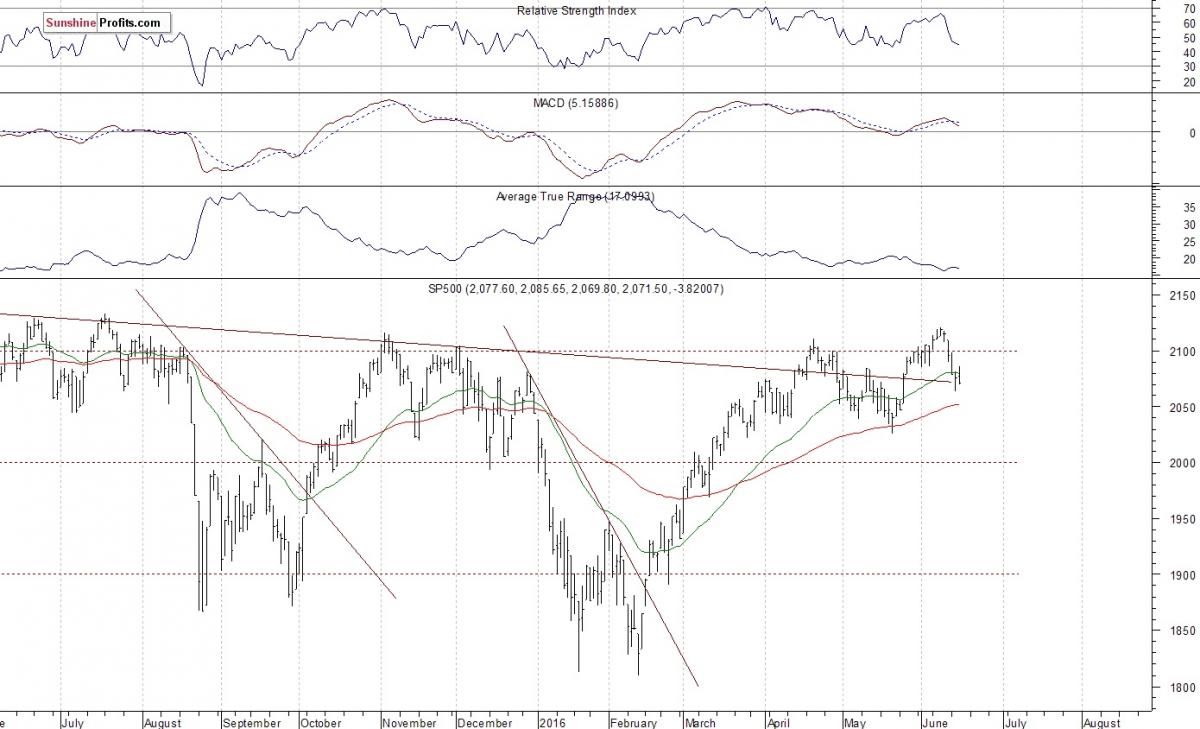
The U.S. stock market indexes lost 0.2-0.4% on Wednesday, extending their short-term consolidation following recent move down, as investors reacted to economic data announcements. The S&P 500 index continues to trade below the level of 2,100. It remains above its May consolidation along the level of 2,050. The nearest important level of support is at around 2,070, and the next support level is at 2,050, marked by some previous local highs. On the other hand, the nearest important level of resistance is at around 2,085, marked by previous support level. The next resistance level remains at 2,100 mark. Last year's highs along the level of 2,100 continue to act as medium-term resistance level. Will the market break above these medium-term highs and continue its seven-year long bull market? Or will it reverse its over three-month long uptrend off medium-term support level at around 1,800?
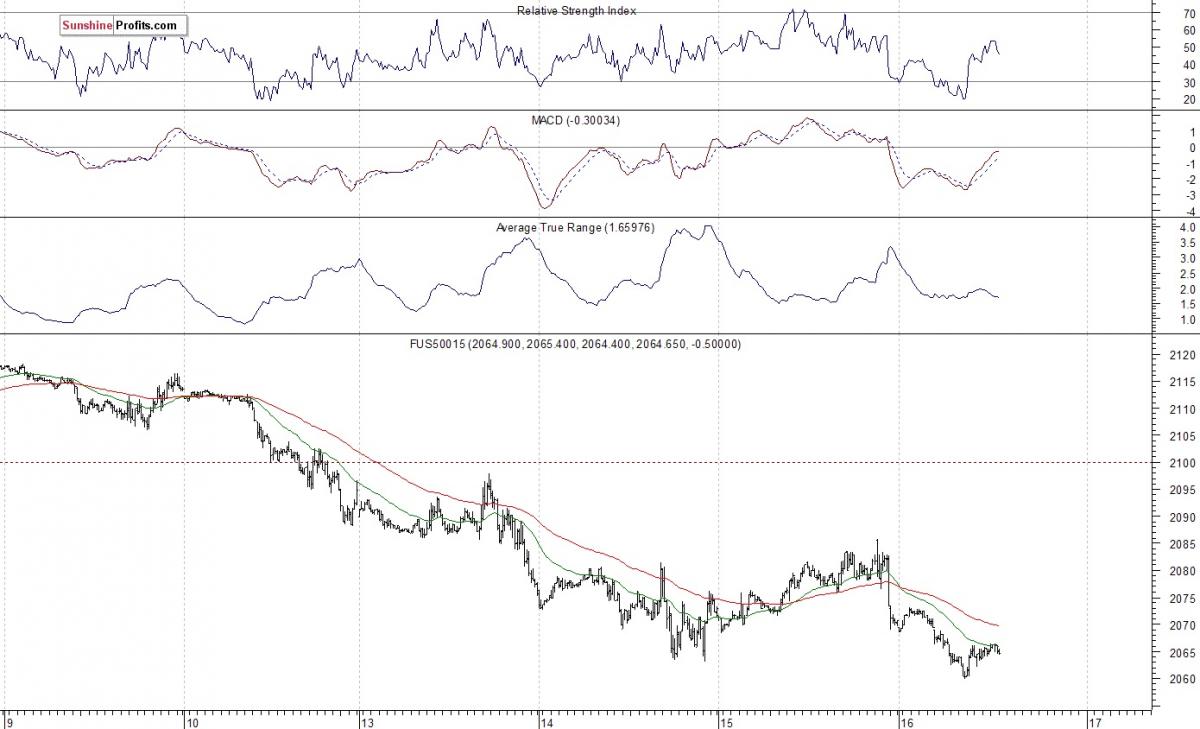
Expectations before the opening of today's trading session are negative, with index futures currently down 0.3-0.4%. The European stock market indexes have lost 0.5-0.7% so far. Investors will now wait for some economic data announcements: Consumer Price Index, Initial Claims, Philadelphia Fed number at 8:30 a.m., NAHB Housing Market Index at 10:00 a.m. The S&P500 futures contract trades within an intraday consolidation, following an overnight selloff. The nearest important level of support is at around 2,060, marked by short-term local low. On the other hand, resistance level is at 2,080-2,085, as we can see on the 15-minute chart:
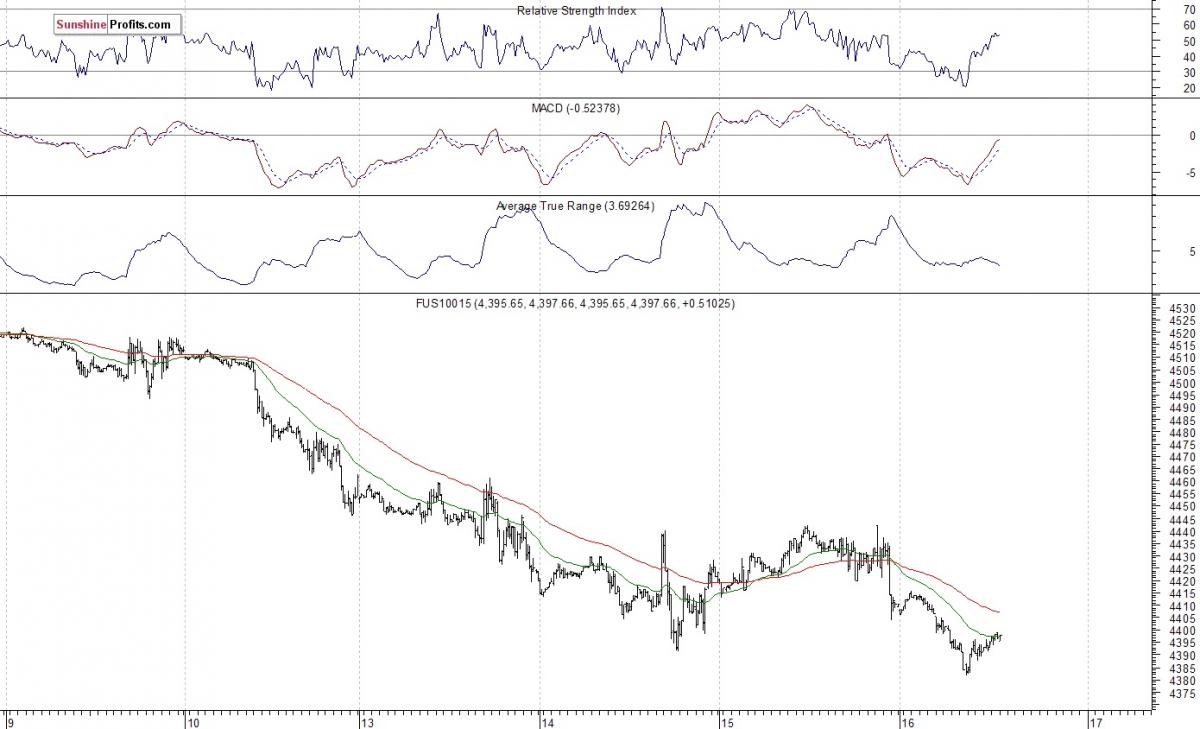
The technology Nasdaq 100 futures contract follows a similar path, as it currently trades slightly below the level of 4,400. The nearest important level of support is at around 4,380, and resistance level is at 4,400-4,420, among others, as the 15-minute chart shows:
Concluding, the broad stock market remained within a short-term consolidation on Wednesday, as investors reacted to the FOMC's Rate Decision release, among others. We continue to maintain our speculative short position (opened on June 1 at 2,093.94 - S&P500 index). However, we decided to move our stop-loss level from 2,140 down to 2,120. Our profit target remains at 2,000 (S&P500 index). You can trade S&P500 index using futures contracts (S&P500 futures contract - SP, E-mini S&P 500 futures contract - ES) or an ETF like the SPDR S&P 500 ETF - SPY. It is always important to set some exit price level in case some events cause the price to move in the unlikely direction. Having safety measures in place helps limit potential losses while letting the gains grow.
More from Silver Phoenix 500


