Stocks Get Close To Record High Again As Fed Hikes Interest Rates


In our opinion, speculative short positions are favored (with stop-loss at 2,410, and profit target at 2,200, S&P 500 index).
Our intraday outlook is bearish, and our short-term outlook is bearish. Our medium-term outlook remains neutral, following S&P 500 index breakout above last year's all-time high:
Intraday outlook (next 24 hours): bearish
Short-term outlook (next 1-2 weeks): bearish
Medium-term outlook (next 1-3 months): neutral
Long-term outlook (next year): neutral
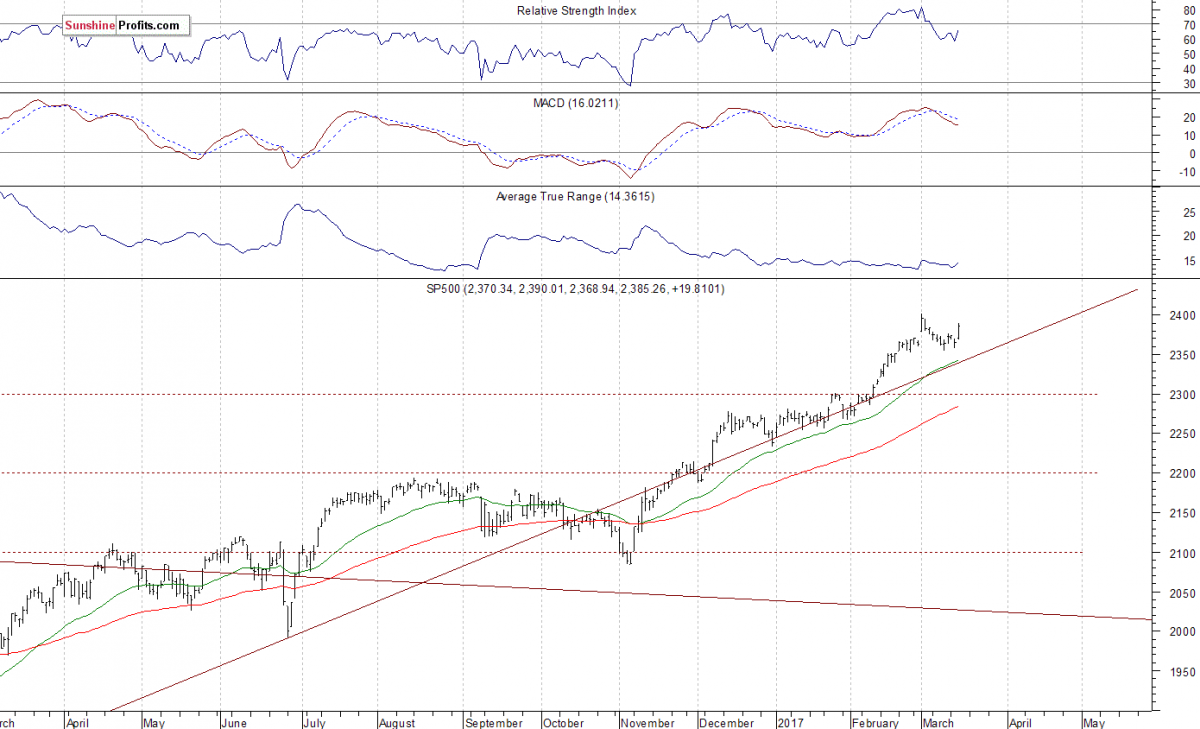
The U.S stock market indexes gained between 0.5% and 0.8% on Wednesday, breaking above their recent consolidation, as investors reacted to the FOMC's Rate Decision announcement. The S&P 500 index has bounced off support level of 2,350-2,360 on Tuesday. It accelerated its short-term uptrend yesterday and got closer to March 1 all-time high of 2,400.98. The Dow Jones Industrial Average has managed to close above 20,900 mark, and the technology Nasdaq Composite index has got close to its record high above 5,900 mark. All three major stock market indexes continue to trade relatively close to their early March new record highs. The nearest important level of support of the S&P 500 index is at around 2,370-2,375, marked by recent local highs. The next support level remains at 2,350-2,360, marked by local lows and the February 21 daily gap up of 2,351.16-2,354.91. The support level is also at around 2,320. On the other hand, the nearest important level of resistance is at around 2,390-2,400, marked by all-time high. Will the market extend its year-long medium-term uptrend even further before some more meaningful downward correction? We can see some short-term volatility following four-month-long rally off last year's November low at around 2,100. Is this a topping pattern before downward reversal? The uptrend accelerated on March 1 and it looked like a blow-off top pattern accompanied by some buying frenzy. The S&P 500 index continues to trade above its over year-long medium-term upward trend line, as we can see on the daily chart:
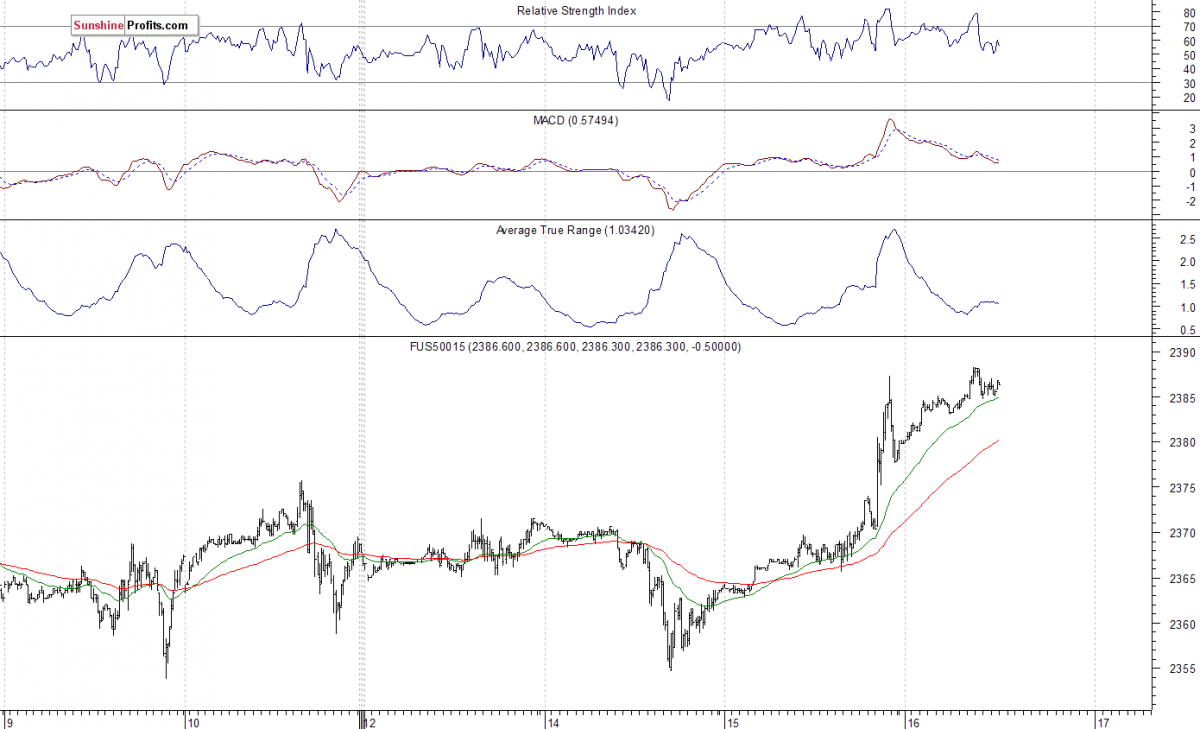
Expectations before the opening of today's trading session are positive, with index futures currently up 0.2-0.3%. The European stock market indexes have gained 0.9-1.0% so far. Investors will now wait for some economic data announcements: Initial Claims, Housing Starts, Building Permits, Philadelphia Fed at 8:30 a.m., JOLTS - Job Openings at 10:00 a.m. The market expects that Housing Starts number was at 1,260K and Building Permits was at 1,251K in February, relatively flat vs. prior data. The S&P 500 futures contract trades within an intraday uptrend, as it retraces yesterday's late session move down. It currently trades along the level of 2,385. The nearest important level of resistance is at around 2,395-2,400, marked by all-time high. On the other hand, support level is at 2,370-2,375, marked by previous level of resistance. The next support level remains at 2,355-2,360, marked by short-term local lows. The market continues to trade within a consolidation following late April - early March rally. There have been no confirmed negative signals so far. Will it break above its early March record high?
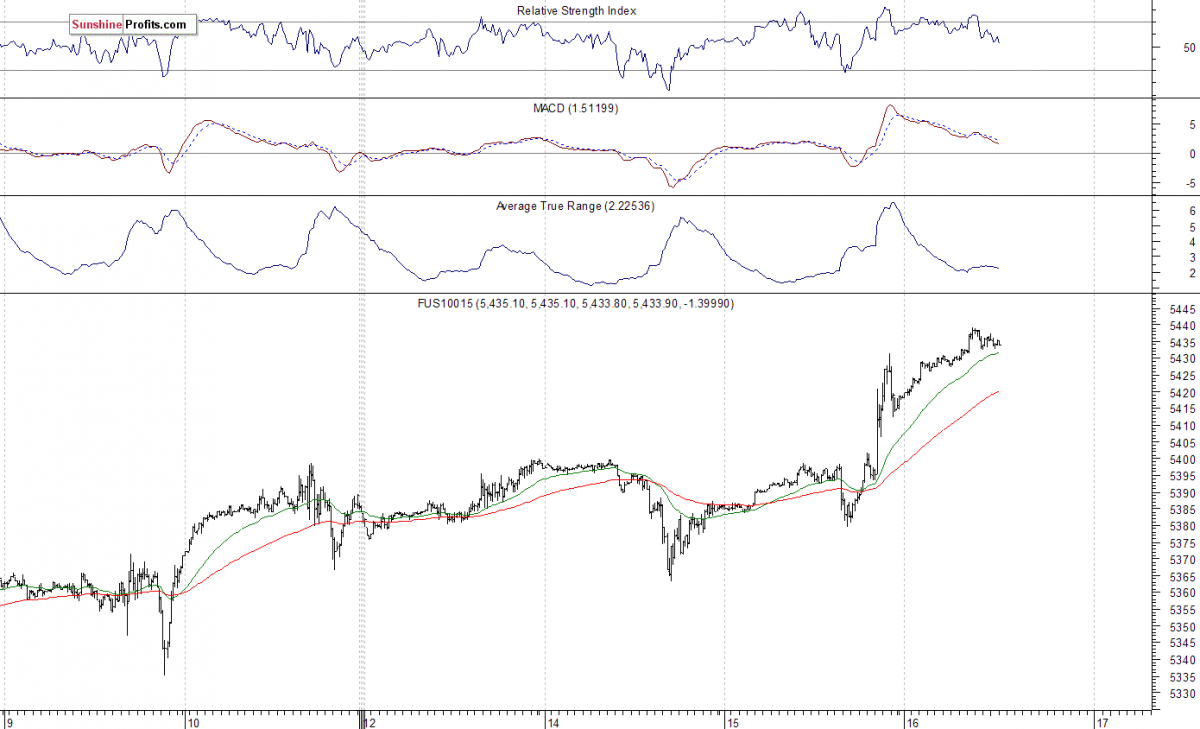
The technology Nasdaq 100 futures contract is relatively stronger than the broad stock market, as it currently trades close to new record high just below 5,440 mark. It has broken above its previous all-time high at around 5,400 yesterday. The market extends its eight-year-long bull-run. The nearest important level of support is at 5,400, marked by previous level of resistance. The next support level remains at 5,370, marked by some local lows, as the 15-minute chart shows:
Concluding, the broad stock market broke above its short-term consolidation yesterday, following Fed's Rate Decision release. The S&P 500 index got close to its early March record high. Will the market resume its medium-term uptrend? There have been no confirmed negative signals so far. However, we still can see medium-term overbought conditions accompanied by negative technical divergences. Therefore, we continue to maintain our speculative short position (opened on February 15 at 2,335.58 - opening price of the S&P 500 index). Stop-loss level is at 2,410 and potential profit target is at 2,200 (S&P 500 index). You can trade S&P 500 index using futures contracts (S&P 500 futures contract - SP, E-mini S&P 500 futures contract - ES) or an ETF like the SPDR S&P 500 ETF - SPY. It is always important to set some exit price level in case some events cause the price to move in the unlikely direction. Having safety measures in place helps limit potential losses while letting the gains grow.
To summarize: short position in S&P 500 index is justified from the risk/reward perspective with the following entry prices, stop-loss orders and profit target price levels:
S&P 500 index - short position: profit target level: 2,200; stop-loss level: 2,410
S&P 500 futures contract (March) - short position: profit target level: 2,197; stop-loss level: 2,407
SPY ETF (SPDR S&P 500, not leveraged) - short position: profit target level: $220; stop-loss level: $241
SDS ETF (ProShares UltraShort S&P500, leveraged: -2x) - long position: profit target level: $15.47; stop-loss level: $12.98.
More from Silver Phoenix 500


