Technical Analysis Of The Markets


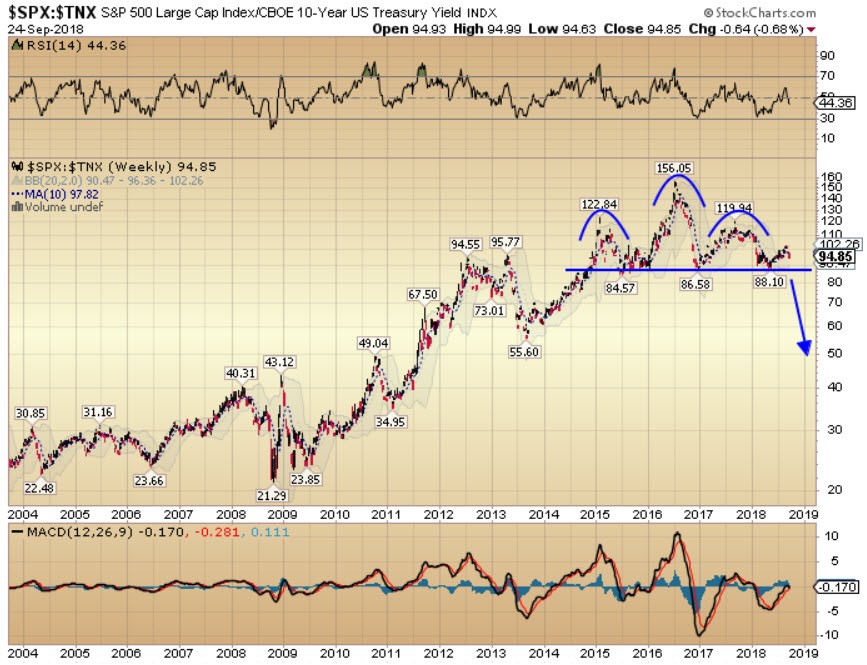
The Correlation Conundrum - Stocks and bonds have rallied sharply since the 2009 lows, delivering positive returns for equity and fixed income investors. This trend peaked in 2016, has drifted lower over the past two years and is now at risk of breaking meaningfully lower. The chart below shows the relationship between the S&P 500 and the US 10-year yield. When stocks rise and bond yields fall in the US (2009-2016), this chart shows a steadily rising trend.
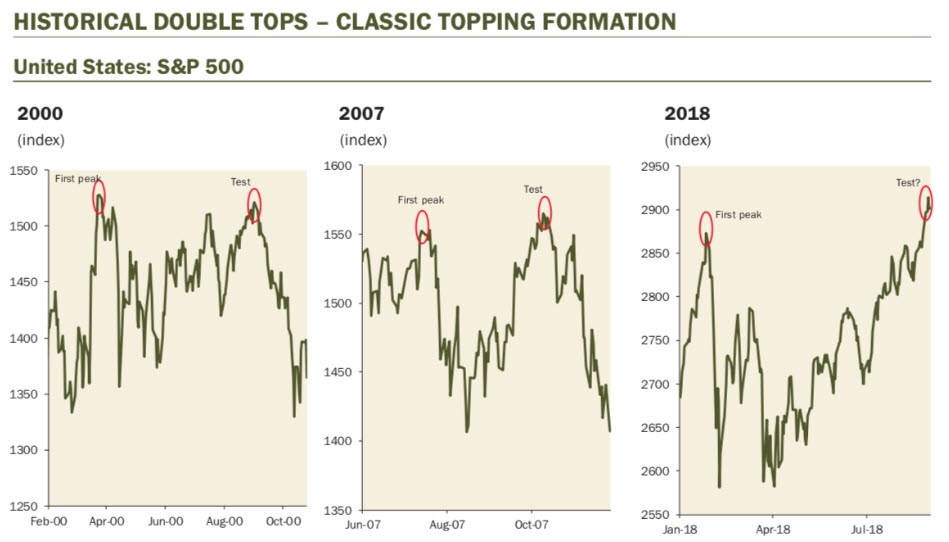
Double Tops - With equity valuations at record highs, corporate debt levels at record highs and yield curve inversion close at hand in the United States, rising volatility and, god forbid, declining stock markets may soon follow. Emerging markets are underperforming year-to-date, in a year of diverging trends, and the S&P 500 might have just double-topped! The US Federal Reserve will likely increase interest rates by another 25 basis points this evening. I am watching for trend changes in growth and defensive assets in the weeks ahead. Read more....
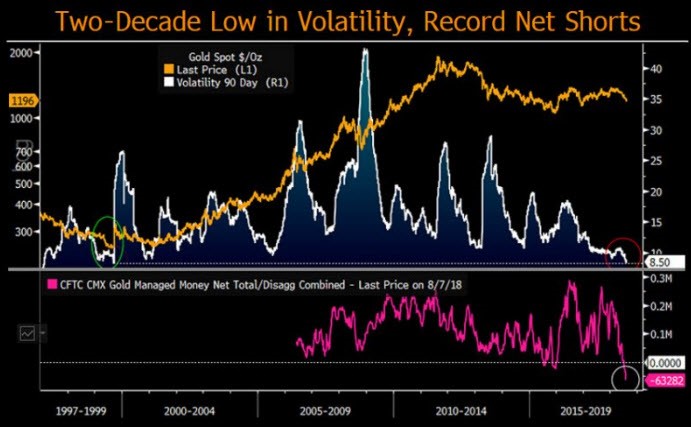
Golden Catalyst - 90-day volatility in the price of gold has reached a 20 year low at the same time as the large speculative short position in gold has reached a multi-decade high. This is a potent combination, which could trigger the next sharp move higher in bullion prices if gold can reverse the recent price decline in the weeks ahead. I cannot think of a more favourable backdrop for precious metals than the current set up....
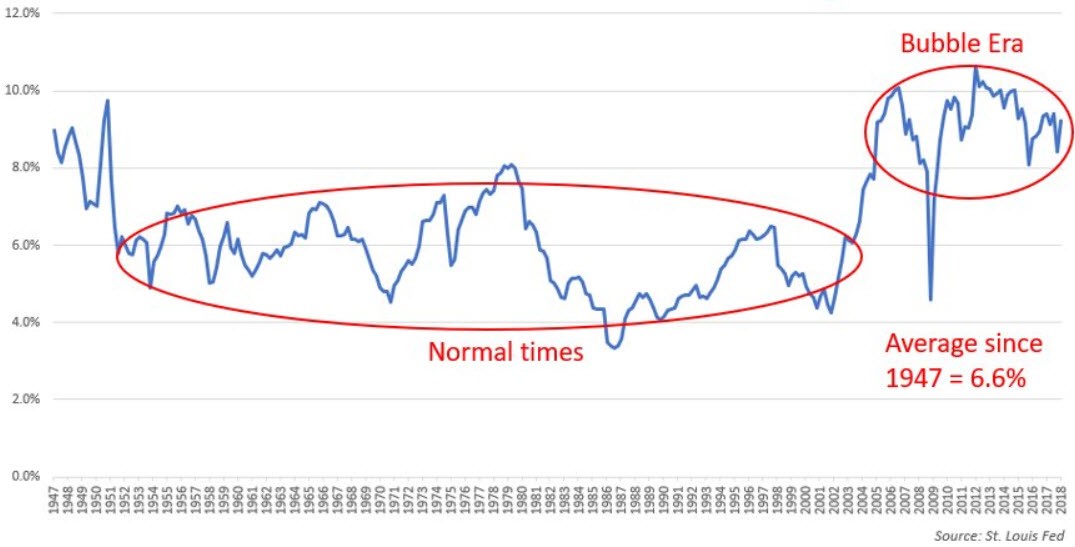
Reversion to the Mean - Since 1947, US net corporate earnings as a percent of GNP have averaged 6.6%. However, something changed in the early 2000’s when the Federal Reserve embarked on their monetary experiment of unlimited money printing. A combination of ultra-loose monetary policy by the Fed and financial engineering by Corporate America has led to a sustained period of strong earnings growth for US companies and a 65% increase in net margins from 6.6% to 9%. Mean reversion during the financial crisis of 2008 looks like a blip on the chart.
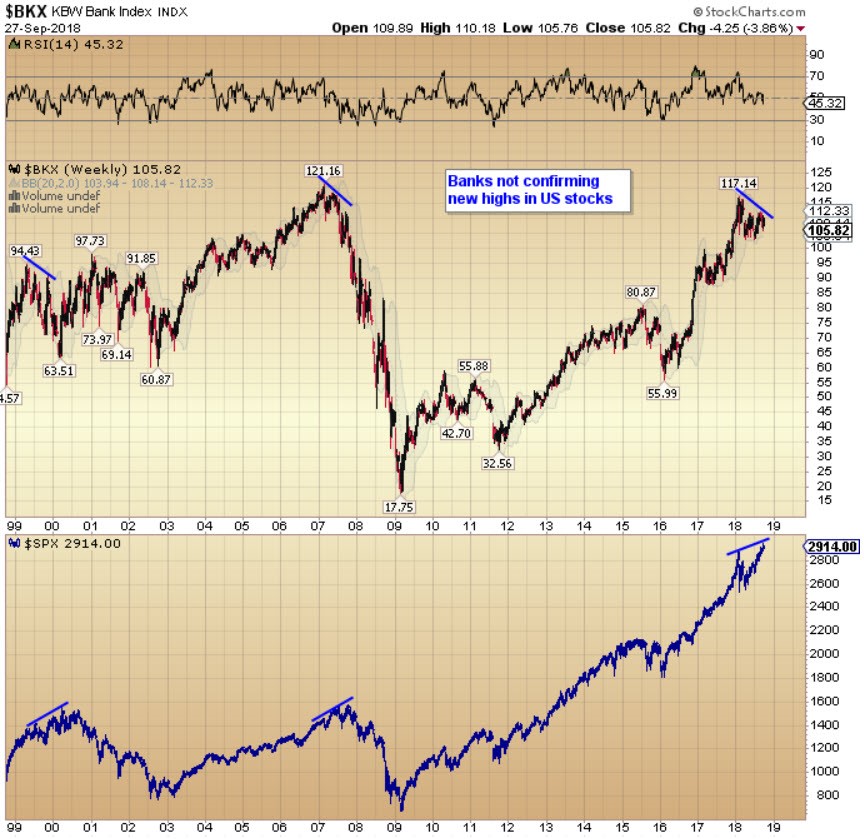
What are the Bank Stocks Telling Us? - The KBW Bank Index comprises 24 of the largest banks in the US. The financial sector is of fundamental importance to the economy and also tends to lead the stock market. A healthy economy and stock market requires a healthy financial sector. The following chart, therefore, caught my eye. In 1999, banking stocks started making a series of lower highs ahead of the stock market topping out the following year. The same trend occurred in 2007 before the financial collapse of 2008 and the same trend is taking place today.

Brian Delaney, CFA
Director, Secure Investments
Tel: +353 86 821 5911
Website: www.secureinvestments.ie
Email: brian@secureinvestments.ie
LinkedIn: Brian Delaney, CFA
Twitter: @briandelaney_
Delaney Investment Services Limited trading as Secure Investments is regulated by the Central Bank of Ireland. Delaney Investment Services Limited is registered in Ireland and is a limited liability company. Registration Number: 516058. Registered Office: 76B Northumberland Road, Ballsbridge, Dublin 4, Ireland.
More from Silver Phoenix 500


