These Factors Show Why Buffett Likes Airlines Again


Last month we learned that Warren Buffett bought shares of American Airlines, Delta Air Lines and United Airlines, according to Berkshire Hathaway’s third-quarter regulatory filings. He also confirmed that he purchased Southwest Airlines stock as well. If we look at the Dow Jones U.S. Airlines Index year-to-date, these allocations appear to have been well-timed.
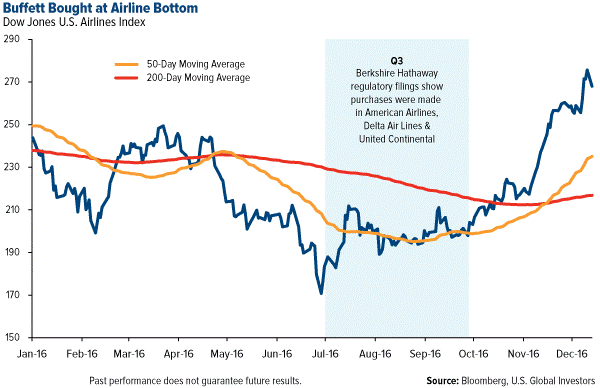
Buffett is universally recognized as one of the most influential investors of all time, so his decision to book a flight on airlines, after blasting the industry for years, is worth examining more closely.
Protected by an Economic Moat
We can mention a couple of things upfront. Most everyone knows Buffett is a value investor. He seeks equity in companies that the market has undervalued—including airlines. As I’ve pointed out before, if we use price-to-earnings as our valuation metric, airlines are among the least expensive in the industrials sector.
He also likes companies that are protected by what he calls a “moat,” the “something” that prevents new competitors from disrupting the industry, giving the veteran players a clear advantage in the marketplace. This is why Buffett has always been attracted to railroads. Because rail is prohibitively capital-intensive, the barriers to entry are high and competition is limited, giving companies greater market power.
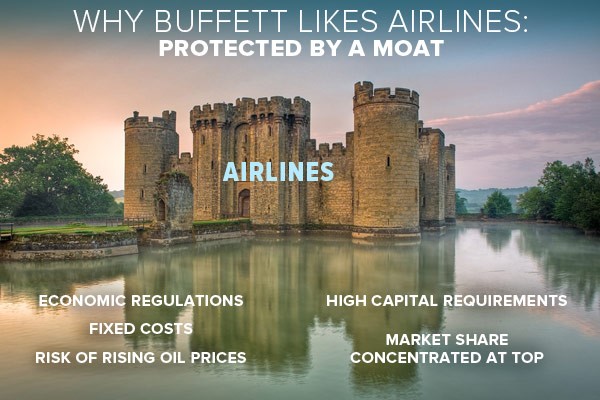
We see a similar moat protecting U.S. airlines. Since the industry consolidated a decade ago after a wave of bankruptcies, a vast majority of the market share is now concentrated in the big four carriers. In 2015, American, Delta, United and Southwest controlled about 77 percent of U.S. airline revenue.
These are pretty high-level factors to consider. When we delve deeper into the factors Buffett uses to assess equities, the airlines group becomes even more attractive.
Airlines Crushed the Broader Market
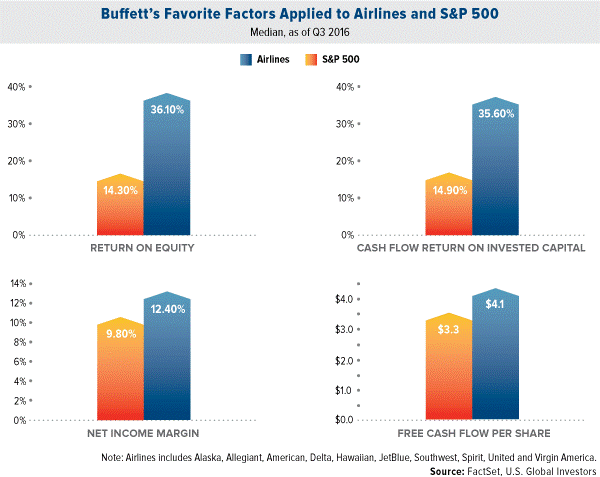
What you see below are the top 10 U.S. airlines compared to the S&P 500 Index, using four of Buffett’s favorite financial metrics: return on equity, cash flow return on invested capital, net income margin and free cash flow per share. As of the third quarter, the airlines group trounced the broader market in all four areas for the 12-month period. This might have contributed to Buffett’s decision to rotate back into a space he spent a couple of decades deriding.
You can find the definitions of these factors on Investopedia, but they’re pretty self-explanatory.
Return on equity (ROE) measures how much profit a company generates with shareholders’ money. Whereas the S&P 500 returned about 14 percent during the 12-month period, airlines returned 36 percent of equity.
Cash flow return on invested capital (CFROIC) tells investors how much cash flow a company produces as a percentage of its total capital. CFROIC was 35.60 percent for carriers, 14.90 percent for blue-chip stocks.
Net income margin, simply put, is the percent difference between a company’s sales and its net profits. In the past, airlines were notorious for having razor-thin margins. That’s all changed thanks to industry consolidation, restructuring of businesses and the addition of new revenue streams. The top 10 airlines saw margins of more than 12 percent, while S&P 500 margins were 9.8 percent.
Finally, free cash flow per share is exactly what it sounds like. It’s sometimes used as a proxy for earnings per share, but it specifically measures a company’s ability to pay back loans, taxes and other expenses on a per-share basis. Airlines beat the S&P 500, $4.1 per share to $3.3 per share.
Airlines have definitely come a long way since Buffett invested in—and lost money on—US Airways back in 1989. If you’re interested in learning more, I invite you to join me during my next webcast. I’ll be discussing how airlines reversed their fortunes from near-bankruptcy to record profitability, and where they might go from here.
I hope you’ll join us!
********
All opinions expressed and data provided are subject to change without notice. Some of these opinions may not be appropriate to every investor.
Dow Jones U.S. Total Market Airlines Index is constructed and weighted using free-float market capitalization and the index is quotes in USD.
The S&P 500 Stock Index is a widely recognized capitalization-weighted index of 500 common stock prices in U.S. companies.
The price-earnings ratio (P/E ratio) is the ratio for valuing a company that measures its current share price relative to its per-share earnings. The price-earnings ratio can be calculated as: market value per share / earnings per share.
Holdings may change daily. Holdings are reported as of the most recent quarter-end. The following securities mentioned in the article were held by one or more accounts managed by U.S. Global Investors as of 9/30/2016: Alaska Air Group Inc., Allegiant Travel Co., American Airlines Group Inc., Delta Air Lines Inc., Hawaiian Holdings Inc., JetBlue Airways Corp., Southwest Airlines Co., Spirit Airlines Inc., United Continental Holdings Inc., Virgin America Inc.
U.S. Global Investors, Inc. is an investment adviser registered with the Securities and Exchange Commission ("SEC"). This does not mean that we are sponsored, recommended, or approved by the SEC, or that our abilities or qualifications in any respect have been passed upon by the SEC or any officer of the SEC.
This commentary should not be considered a solicitation or offering of any investment product.
Certain materials in this commentary may contain dated information. The information provided was current at the time of publication.
 Frank Holmes is the CEO and Chief Investment Officer of U.S. Global Investors. Mr. Holmes purchased a controlling interest in U.S. Global Investors in 1989 and became the firm’s chief investment officer in 1999. Under his guidance, the company’s funds have received numerous awards and honors including more than two dozen Lipper Fund Awards and certificates. In 2006, Mr. Holmes was selected mining fund manager of the year by the Mining Journal. He is also the co-author of “The Goldwatcher: Demystifying Gold Investing.” Mr. Holmes is engaged in a number of international philanthropies. He is a member of the President’s Circle and on the investment committee of the International Crisis Group, which works to resolve conflict around the world. He is also an advisor to the William J. Clinton Foundation on sustainable development in countries with resource-based economies. Mr. Holmes is a native of Toronto and is a graduate of the University of Western Ontario with a bachelor’s degree in economics. He is a former president and chairman of the Toronto Society of the Investment Dealers Association. Mr. Holmes is a much-sought-after keynote speaker at national and international investment conferences. He is also a regular commentator on the financial television networks CNBC, Bloomberg and Fox Business, and has been profiled by Fortune, Barron’s, The Financial Times and other publications. Visit the U.S. Global Investors website at http://www.usfunds.com.


