Think Exits Not Entries


Trading and chart software provides many features. The ones most commonly used are alerts for extremes. Session opening and closes. Highs and lows of the day (week, month, year). Volume, range and price percentage spikes and so forth. Humans are drawn to drama in the news and extremes overall. It provides satisfaction to one of our most basic human needs. The need for variety. This doesn’t mean it being the best time to enter a position. Quite the contrary. While most use alert settings for these extremes to glance at their charts and get excited to participate through entries, professionals use these events to absorb the needed liquidity to exit positions. We encourage you to think exits not entries next time you find yourself glued to the screen woken by an atypical news item for example.
When silver closed strongly near US$18 on Friday May 29th for its weekly session, we knew the world would wake up over the weekend:
Silver, Weekly Chart: Silver Near Range Highs
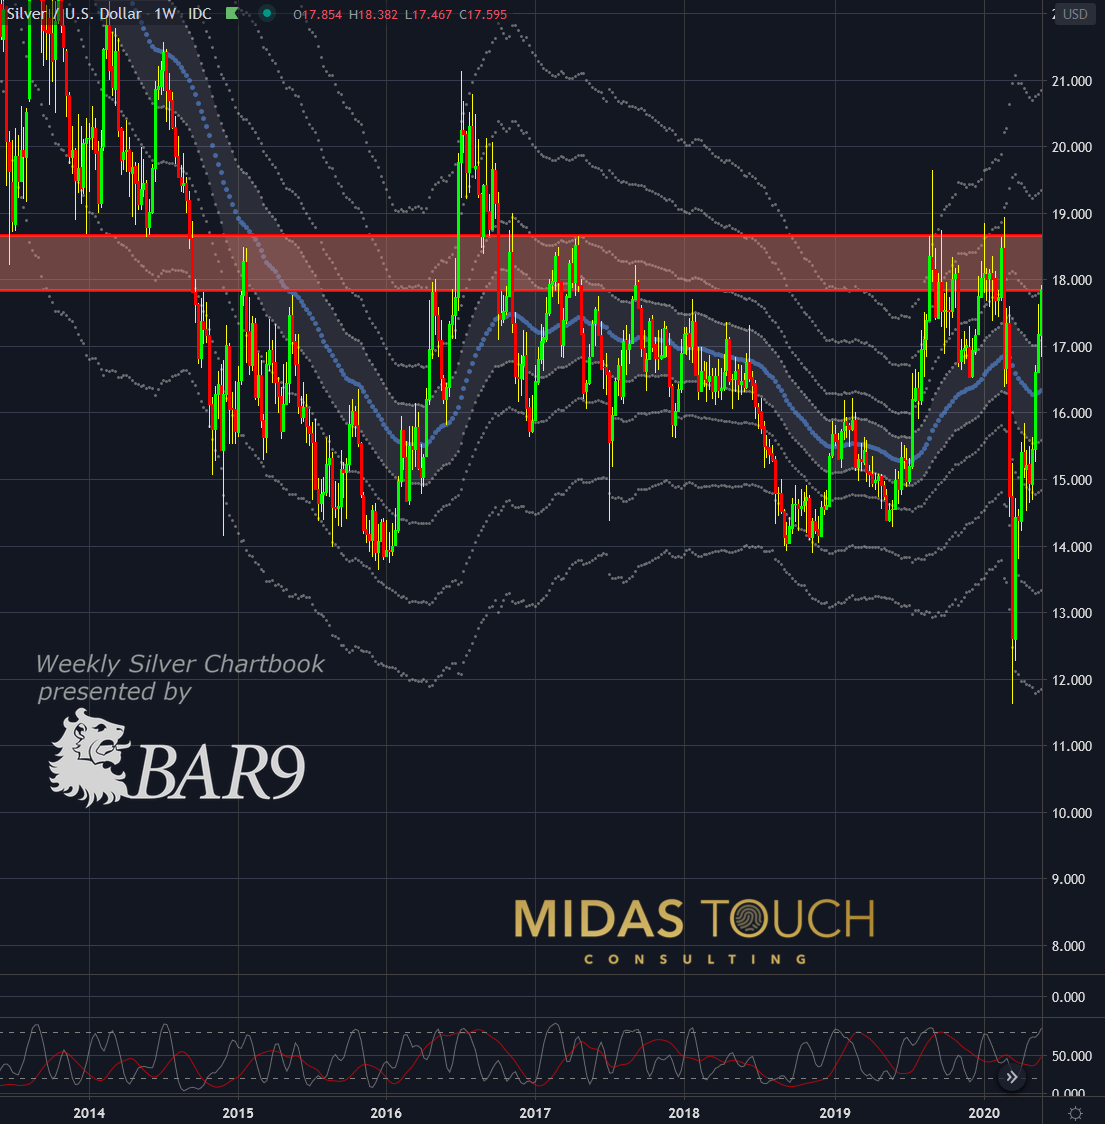
Silver in US-Dollar, weekly chart as of May 31st, 2020.
The weekly chart above shows how prices had reached an important early fractal resistance zone where “extreme alerts” would be triggered. The world would notice and weekend chartists would wake up, they would ask: ”Where is my entry?”
For us a trigger to think exits. (One supporting factor on that Friday’s close was , that as much as silver closed near its daily highs, Gold instead was already trading lower from an intraday perspective. This indicated relative weakness in the precious metal sector. Usually, silver follows gold. However, gold was a giveaway that the steam had ran out.
Silver, Daily Chart: Think Exits Not Entries
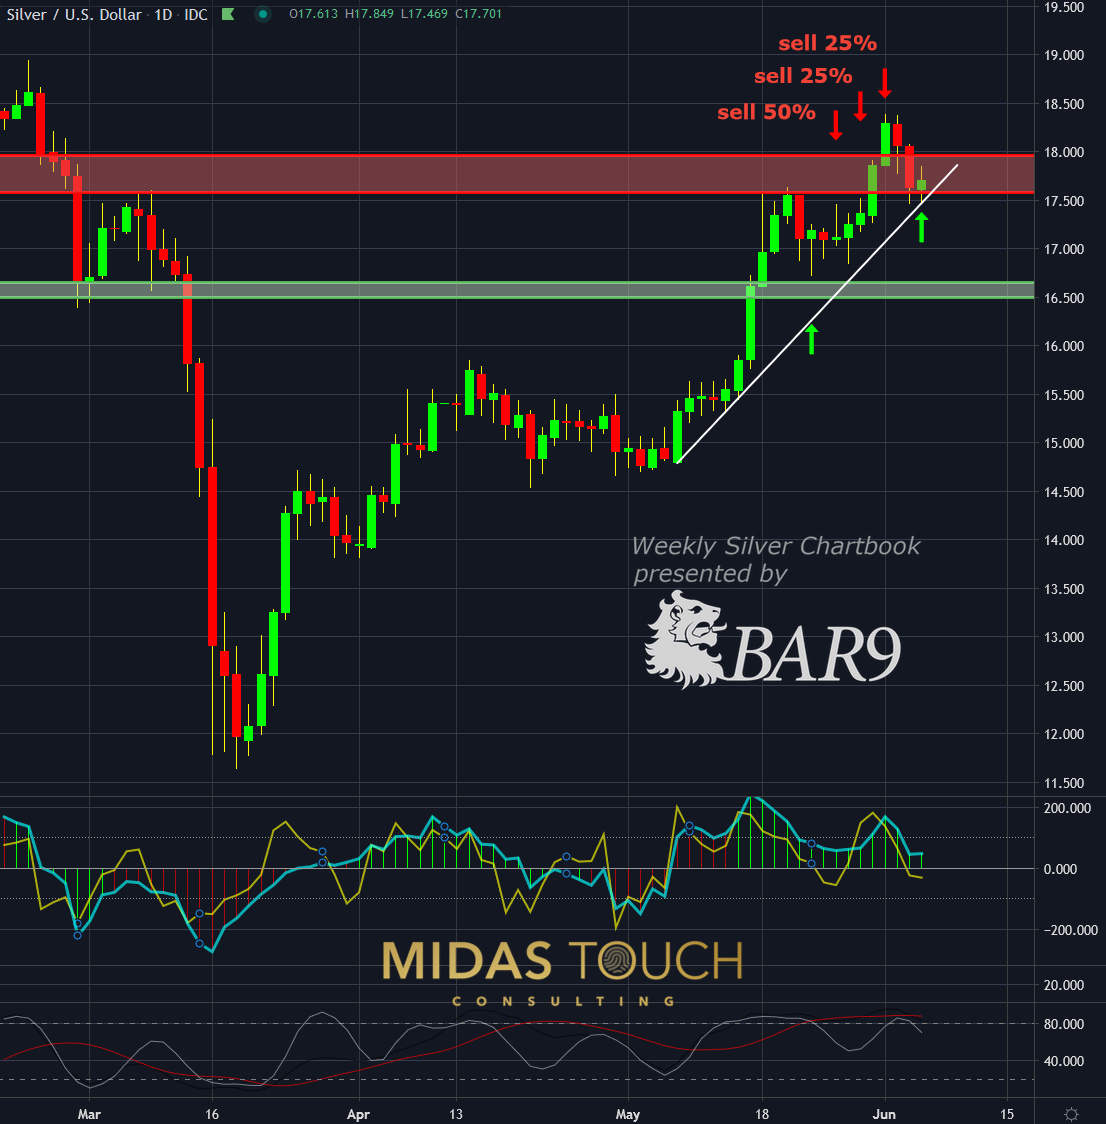
Silver in US-Dollar, daily chart as of June 5th, 2020.
While the world was concerned if the resistance zone would hold and where to enter on a possible breakout scenario we fine-tuned our exit. The following Sunday on May 31st all the placed buy orders created a gap up opening. The market nearly closed its gap, rallied one more time and as soon as we saw weakness in the market we exited. Our exit was US$18.30. Shortly thereafter volatility set in and after a triple top on the 60 minute, chart prices declined and a two day sell off was in place. Once the dust had settled we went long at US$17.46 again.
This daily chart shows the entire trade and illustrates clearly, that it was exits that made this trade profitable. Market situations can be highly variable and as such a tool is needed to accommodate the markets complexity. Our quad exit strategy allows for variable choices in exit taking. We posted all entries and exits in real time in our free telegram channel.
Silver, Monthly Chart: Overall Bullish
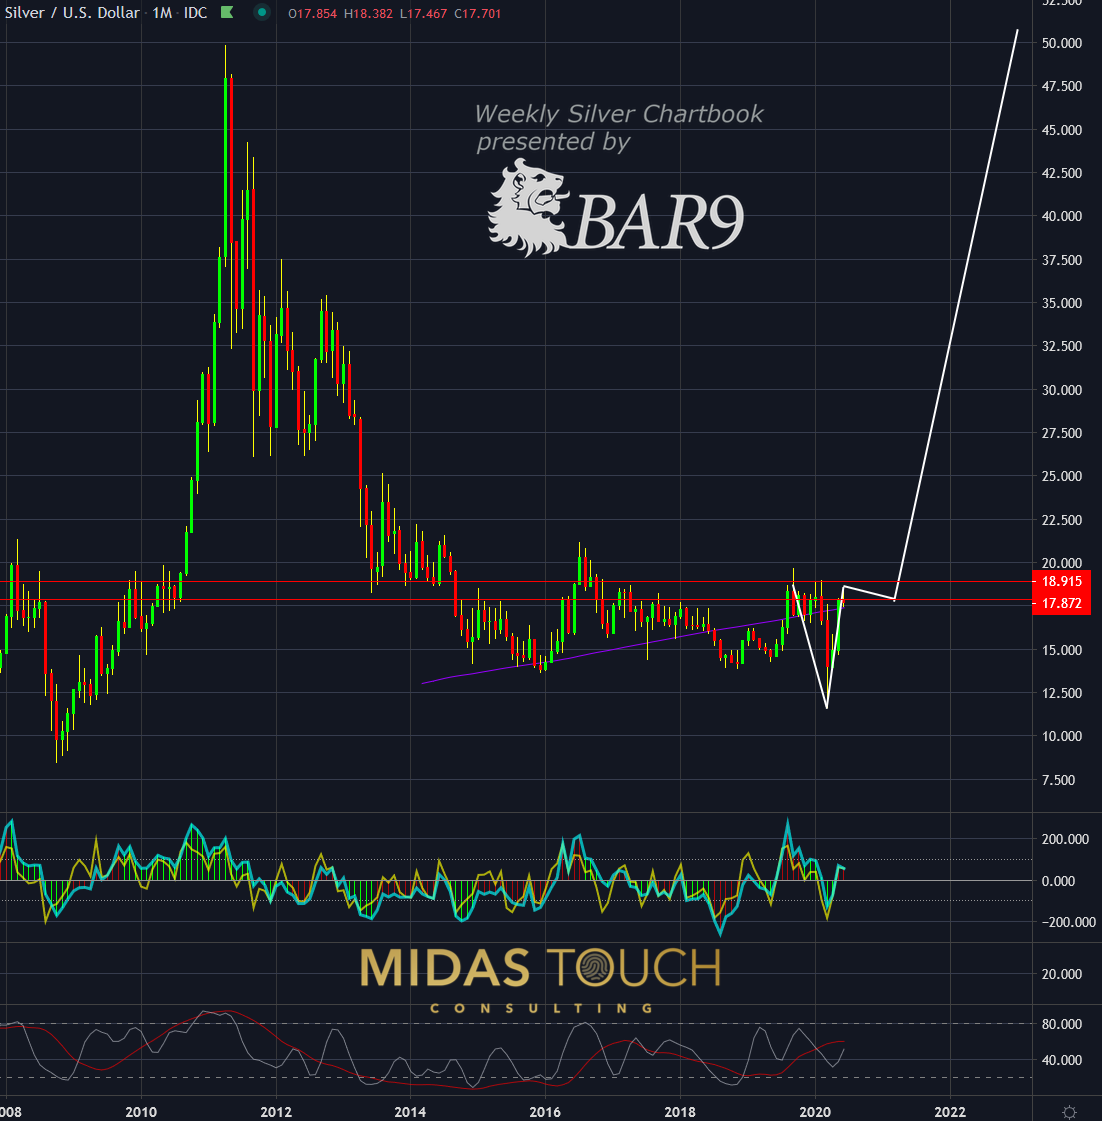
Silver in US-Dollar, monthly chart as of June 5th, 2020.
The bigger picture, always the most important one, shows that it wasn’t likely that we see a price break of a long established channel. As much as prices have advanced from US$11.64 to US$18.38, after such an enormous move indicating a “V” formation reversal, a quick breather was likely to expect. However, “V” formations are the strongest reversal formations and indicate a bullish note for the future.
Think exits not entries
Most average traders and investors have sub optimal system performance since they consistently ask themselves: “Where is my next entry?”.
The better set of questions would be: “How many of the recent up legs was my system able to participate in?”; “Where does the chart provide good low risk opportunities with attractive risk reward ratios?” This question forces you automatically to look at exits.
It isn’t entries that get you rich, it is exits. Good profit taking and target exiting supports the needed consistency and profitability of an advanced trading or investment strategy.
We post real time entries and exits for the silver market in our free Telegram channel.
If you like to get regular updates on our gold model, precious metals and cryptocurrencies you can subscribe to our free newsletter.
By Korbinian Koller|2020-06-05T07:37:13+02:00June 4th, 2020|Tags: Gold, Gold Analysis, Gold/Silver-Ratio, low risk, Silver, Silver Chartbook, technical analysis, time frame, trading principles|0 Comments
Share This Story, Choose Your Platform!
facebooktwitterlinkedinreddittumblrpinterestvkEmail
About the Author: Korbinian Koller
********

Outstanding abstract reasoning ability and ability to think creatively and originally has led over the last 25 years to extract new principles and a unique way to view the markets resulting in a multitude of various time frame systems, generating high hit rates and outstanding risk reward ratios. Over 20 years of coaching traders with heart & passion, assessing complex situations, troubleshoot and solve problems principle based has led to experience and a professional history of success. Skilled natural teacher and exceptional developer of talent.Avid learner guided by a plan with ability to suppress ego and empower students to share ideas and best practices and to apply principle-based technical/conceptual knowledge to maximize efficiency. 25+ year execution experience (50.000+ trades executed) Trading multiple personal accounts (long and short-and combinations of the two). Amazing market feel complementing mechanical systems discipline for precise and extreme low risk entries while objectively seeing the whole picture. Ability to notice and separate emotional responses from the decision-making process and to stand outside oneself and one’s concerns about images in order to function in terms of larger objectives. Developed exit strategies that compensate both for maximizing profits and psychological ease to allow for continuous flow throughout the whole trading day. In depth knowledge of money management strategies with the experience of multiple 6 sigma events in various markets (futures, stocks, commodities, currencies, bonds) embedded in extreme low risk statistical probability models with smooth equity curves and extensive risk management as well as extensive disaster risk allow for my natural capacity for risk-taking.
More from Silver Phoenix 500


