$TNX: Curveball Update


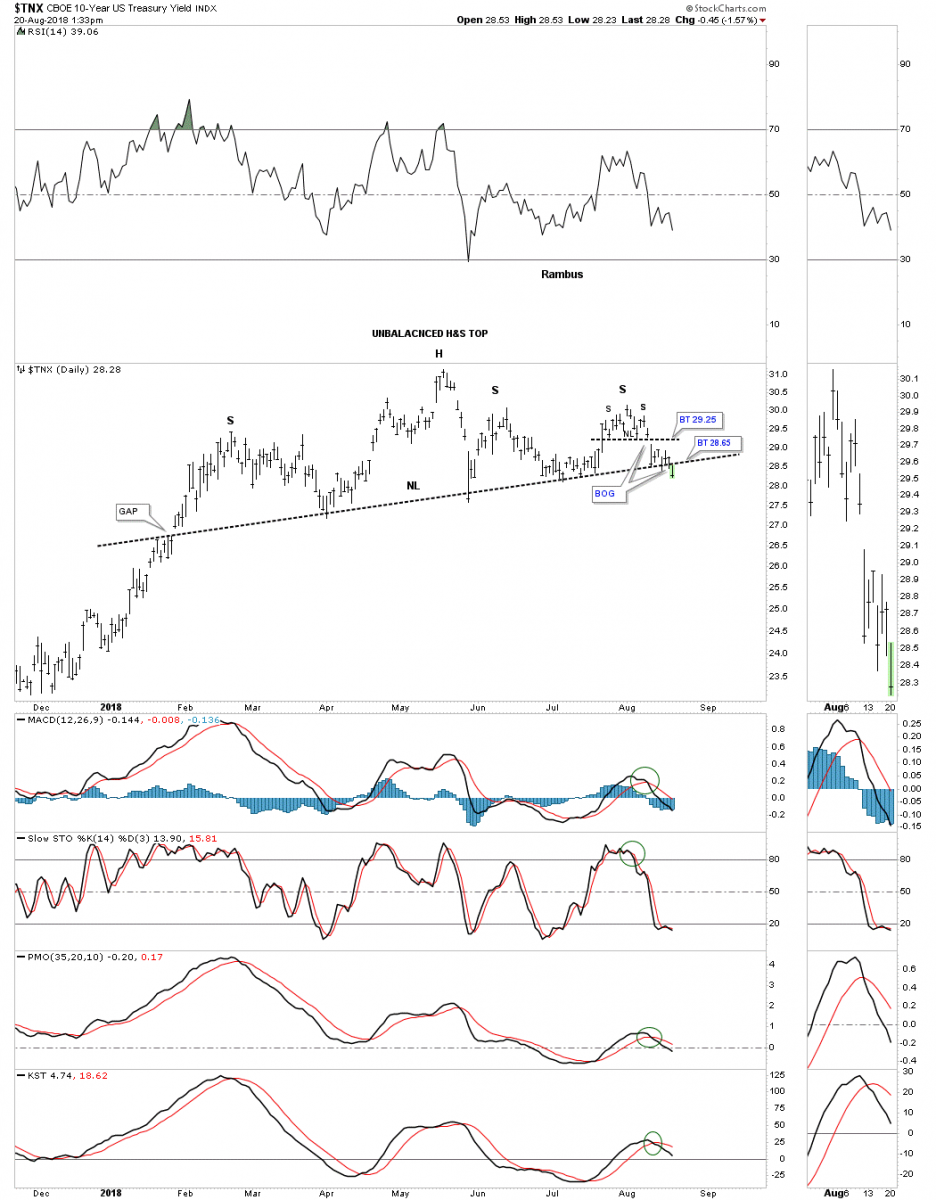
Over the last several months or so I’ve been writing about the bond market throwing us a possible curveball. Instead of continuing rising interest rate we may see falling rates. Today the $TNX, 10 year treasury yield finally broke below the neckline we’ve been following that started to developing back in January of this year. I’ve labeled the H&S top as an unbalanced H&S top as the price action formed a second right shoulder that was a small H&S top. A backtest to the neckline would now come into play around the 28.65 area.
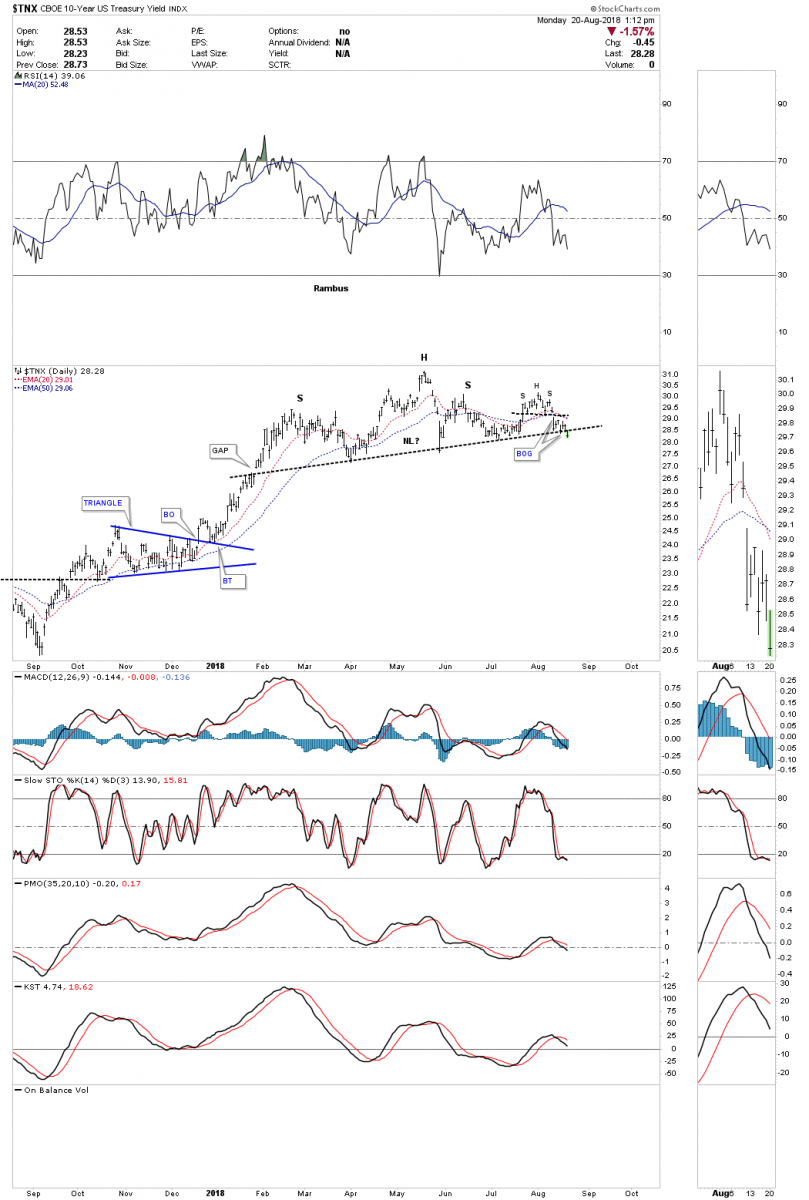
A longer-term daily chart.
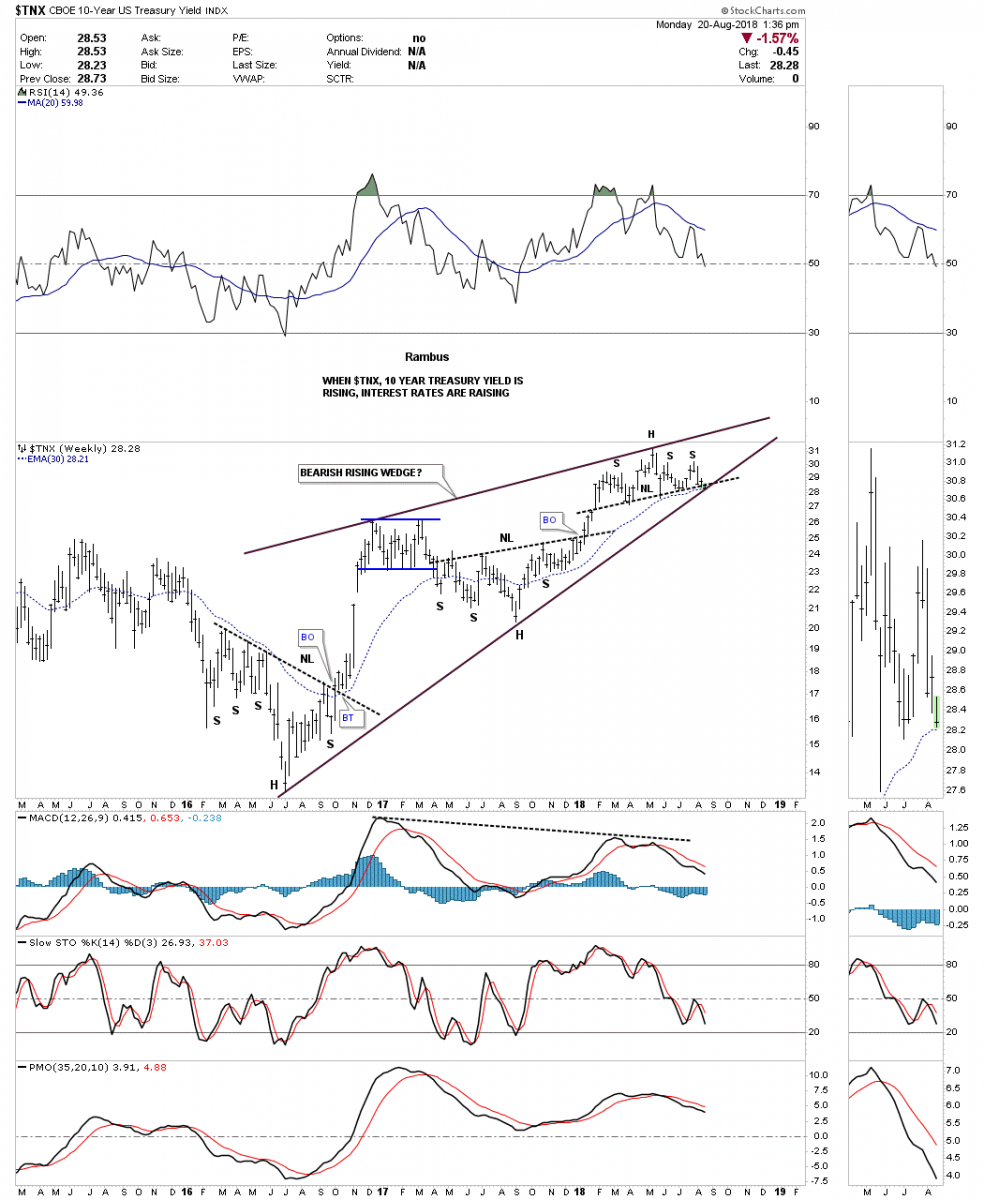
The weekly chart shows the $TNX has been rising for the last two years building out a possible bearish rising wedge with the H&S top forming at the top. That H&S top is strongly suggesting the bottom rail of the black rising wedge is going to give way to the downside. The curveball has almost reached home plate.
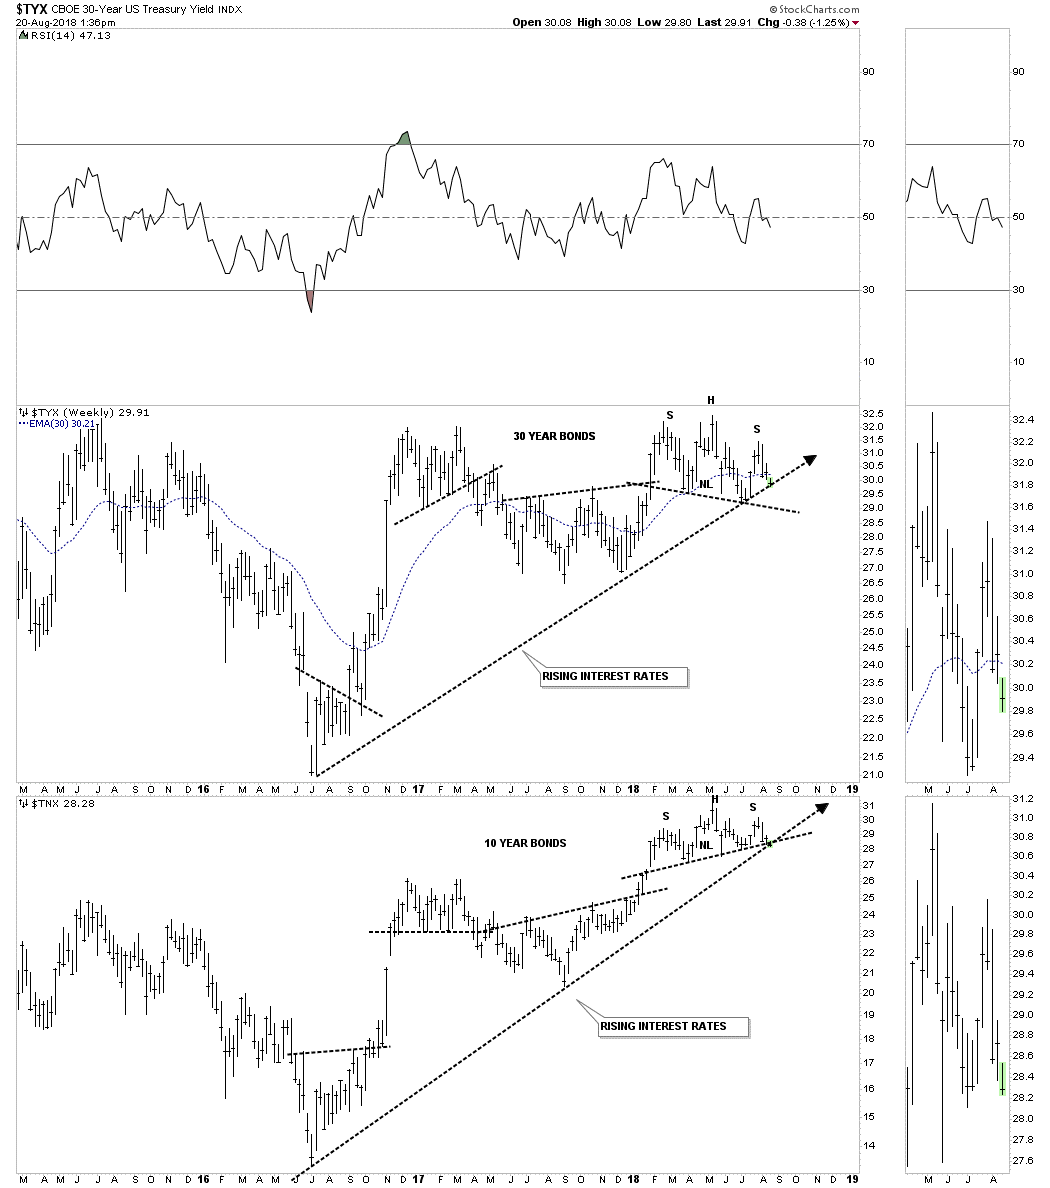
Below is a combo chart which has the $TYX, 30 year bond on top and the $TNX 10 year bond on the bottom.
 Rambus Chartology is Primarily a Goldbug TA Site following the precious metals markets. Chartology is the Unique Blend of Technical Chart Pattern Identification and Market Psychology, Developed by Rambus During the Tech Mania of the late 1990s. His Early Training came the old fashioned way...Reading Edwards and McGee's Bible of Technical Analysis and spending years with a sharp pencil graph paper and ruler refining his skills and accuracy. Visit the Rambus Chartology website at http://rambus1.com/.
More from Silver Phoenix 500


