Uncertainty Following Economic Data, Earnings Releases…S&P500 Still Close To 2100


In our opinion, no speculative positions are justified.
Our intraday outlook is neutral, and our short-term outlook is neutral. Our medium-term outlook remains bearish, as the S&P500 index extends its lower highs, lower lows sequence:
Intraday outlook (next 24 hours): neutral
Short-term outlook (next 1-2 weeks): neutral
Medium-term outlook (next 1-3 months): bearish
Long-term outlook (next year): neutral
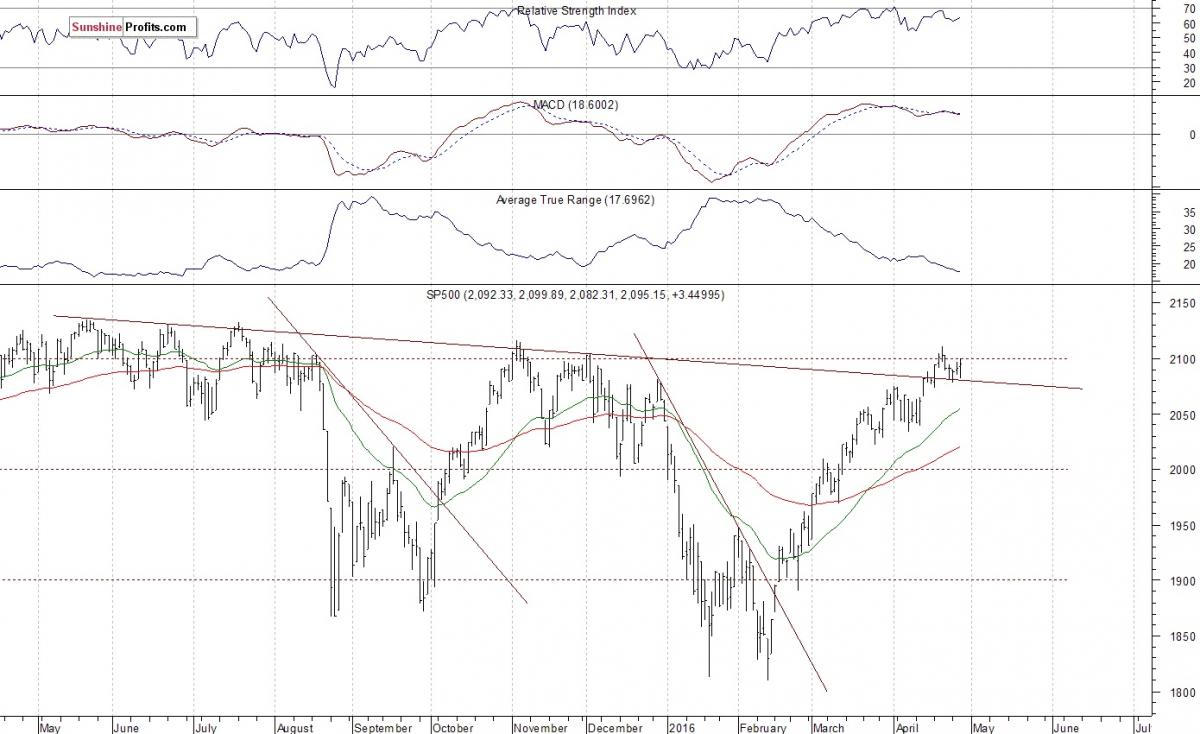
The US stock market indexes were mixed between -0.8% and +0.3% on Thursday, extending their short-term consolidation, as investors reacted to the FOMC Rate Decision announcement, quarterly earnings releases. The S&P500 index continues to trade along the level of 2100, following two-month long rally off February low at around 1800. Is this just a flat correction within an uptrend or a topping pattern before some more meaningful downturn? The nearest important level of resistance is at 2100-2115, marked by last year's medium-term local highs. The next important level of resistance is at 2120-2135, marked by last year's May S&P500's all-time high of 2134.72. On the other hand, support level is at 2075-2080, marked by some short-term local lows, and the next level of support is at around 2065, marked by the daily gap up of 2065.05-2065.92. There have been no confirmed negative signals so far. However, we still can see some technical overbought conditions:
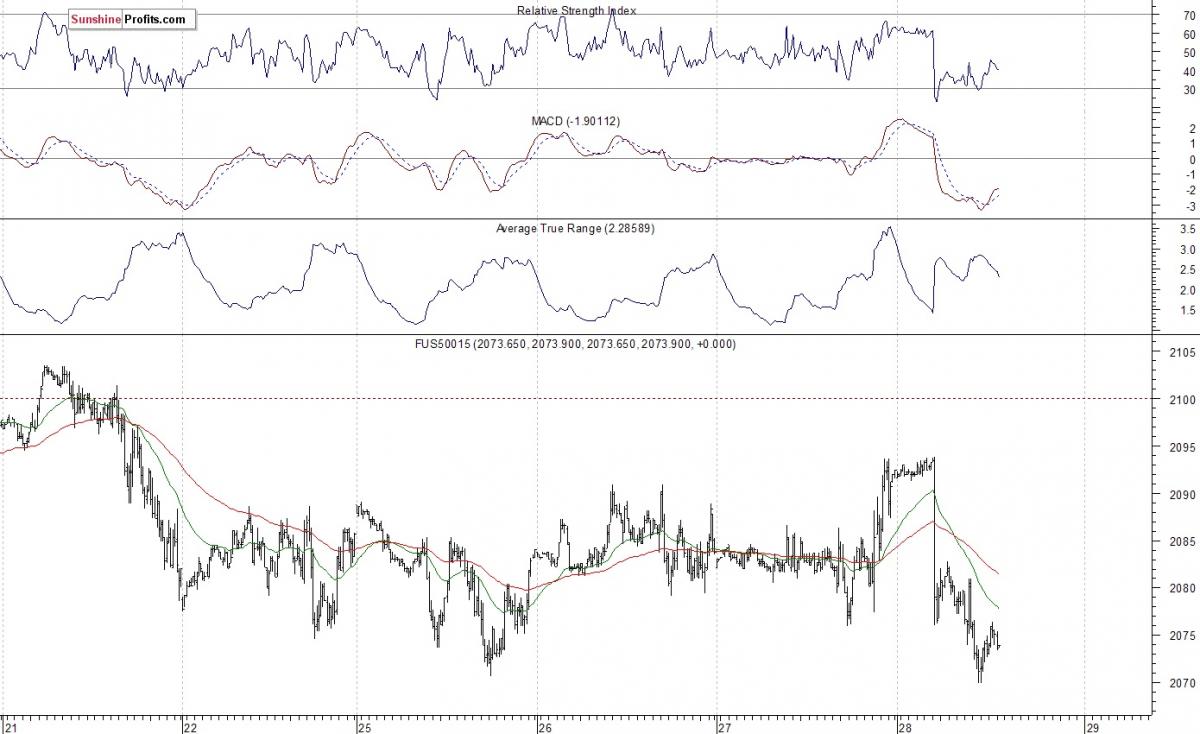
Expectations before the opening of today's trading session are negative, with index futures currently down 0.6-0.8%. The main European stock market indexes have lost 1.1-1.5% so far. Investors will now wait for some economic data announcements: GDP - Advance number, Initial Claims at 8:30 a.m. The S&P500 futures contract trades within an intraday downtrend, as it retraces its yesterday's move up. The nearest important level of resistance is at around 2080, and the next resistance level remains at 2090-2100, marked by recent local highs, as we can see on the 15-minute chart:
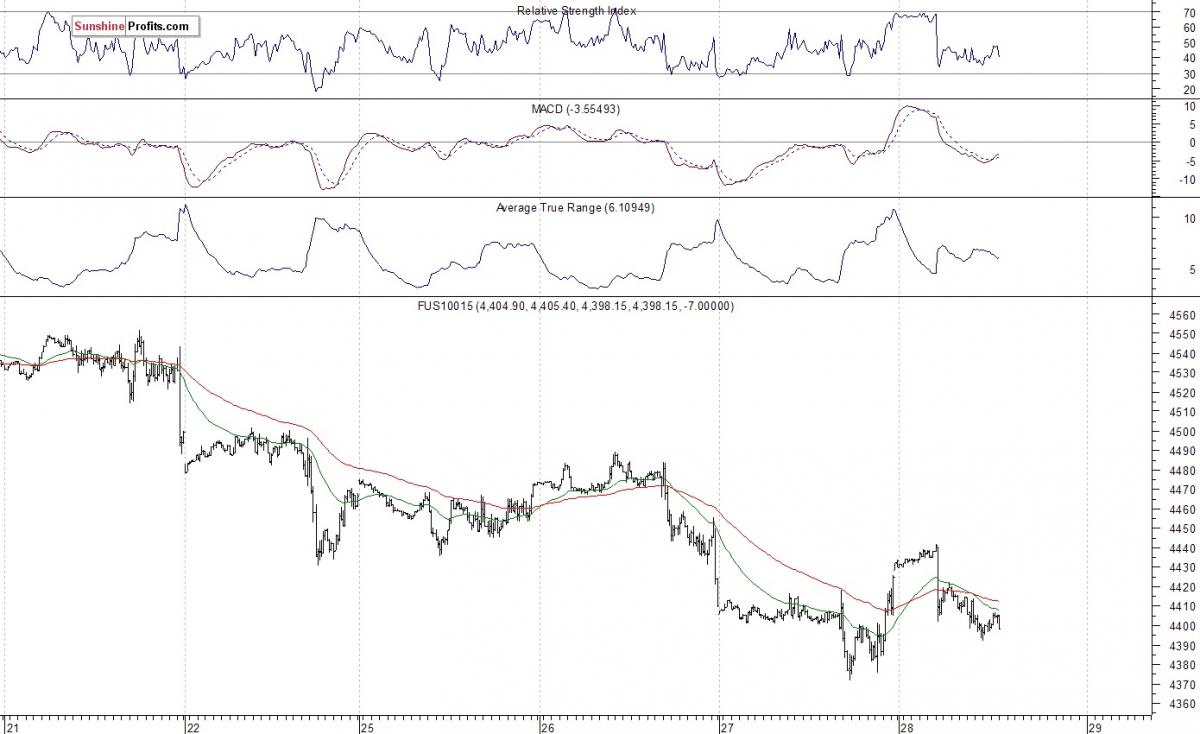
The technology Nasdaq 100 futures contract follows a similar path, as it retraces its yesterday's advance - despite better-than-expected Facebook's quarterly earnings release. The nearest important level of resistance is at around 4450, marked by short-term local high. On the other hand, support level is at 4370-4400, marked by yesterday's low, among others, as the 15-minute chart shows:
Concluding, the broad stock market extends its short-term fluctuations, as the S&P500 index trades slightly below the level of 2100. We still can see technical overbought conditions that may lead to uptrend's reversal or downward correction. However, there have been no confirmed short-term negative signals so far. For now, it looks like a flat correction within two-month-long medium-term uptrend. We prefer to be out of the market, avoiding low risk/reward ratio trades. We will let you know when we think it is safe to get back in the market.
More from Silver Phoenix 500


