Uncertainty Following Two-Month Long Stocks Rally…Will It Continue?


In our opinion, no speculative positions are justified.
Our intraday outlook is neutral, and our short-term outlook is neutral. Our medium-term outlook remains bearish, as the S&P 500 index extends its lower highs, lower lows sequence:
Intraday outlook (next 24 hours): neutral
Short-term outlook (next 1-2 weeks): neutral
Medium-term outlook (next 1-3 months): bearish
Long-term outlook (next year): neutral
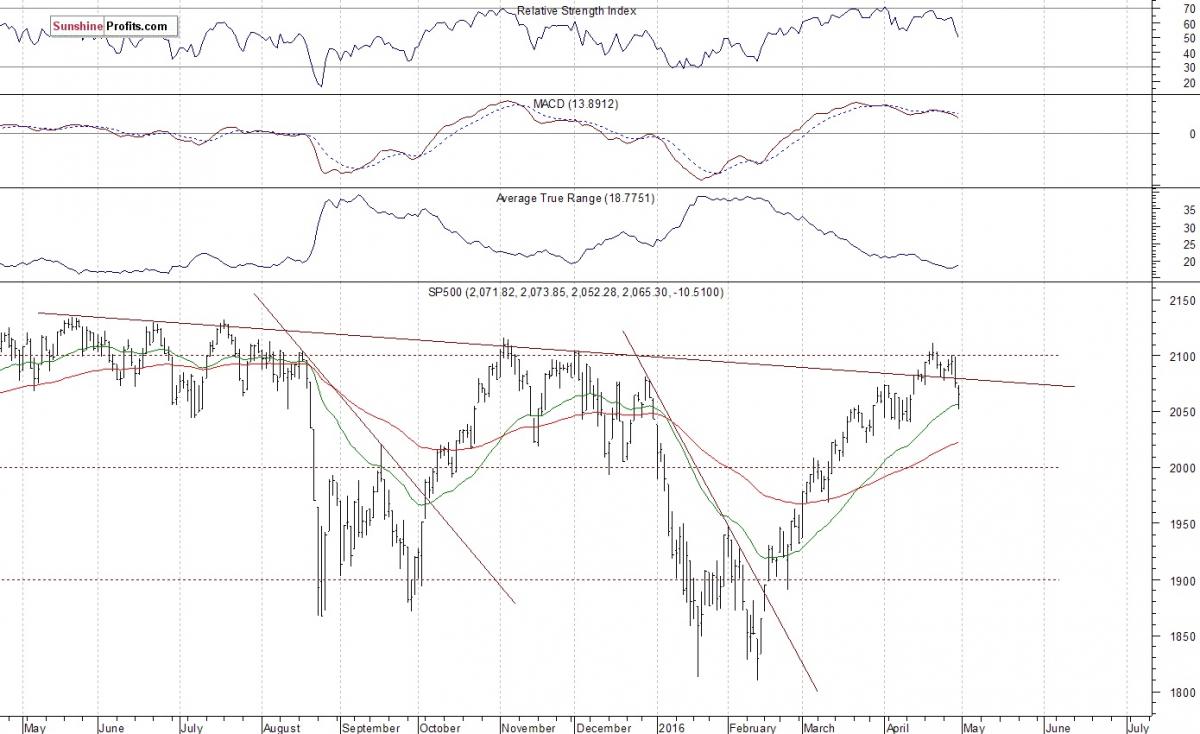
The U.S. stock market indexes lost between 0.3% and 0.5% on Friday, extending their short-term downtrend, as investors reacted to economic data, quarterly earnings releases. The S&P 500 index broke below its recent consolidation. Then it got close to support level of 2,050. However, the index has managed to bounce off that support level and close its trading session at around 2,065. On the other hand, resistance level is at 2,070-2,075, marked by the recent consolidation. The next level of resistance remains at 2,100-2,115, marked by last year's medium-term local highs. Is this the end of two-month long uptrend? Or is this just a correction before another leg up reaching last year's all-time high? We still can some see technical overbought conditions:
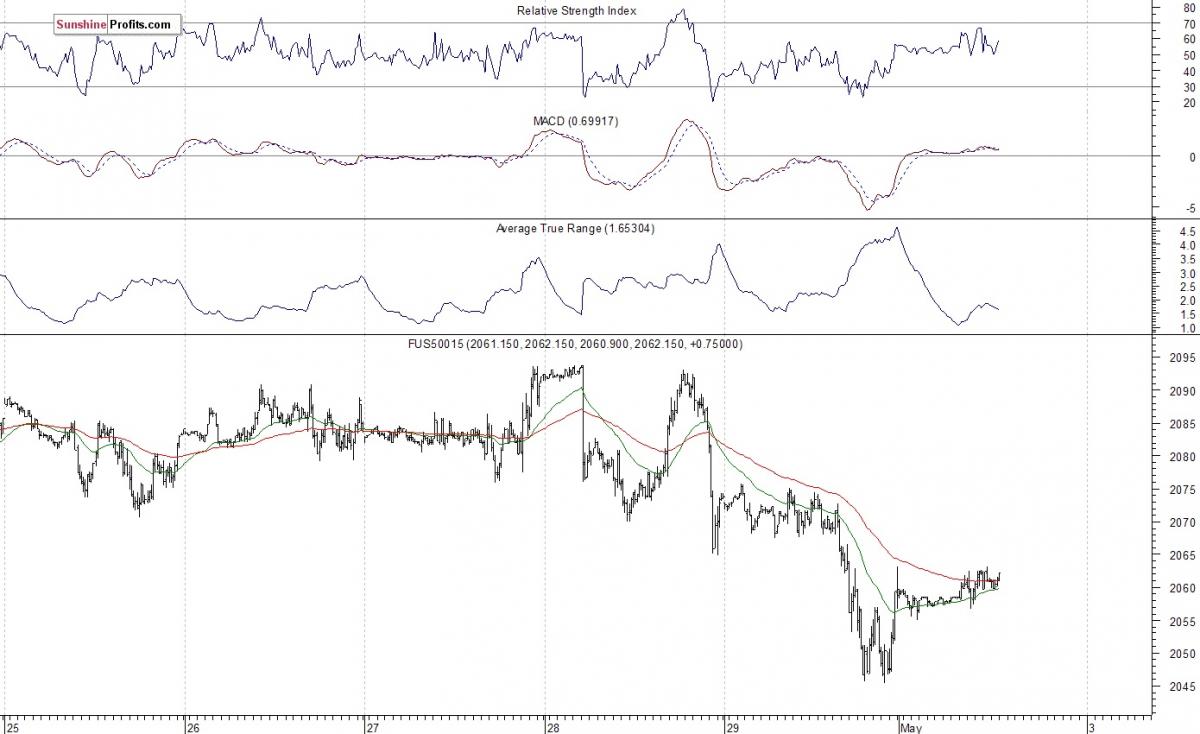
Expectations before the opening of today's trading session are virtually flat. The European stock market indexes have gained 0.4-0.8% so far. Investors will now wait for some economic data announcements: ISM Index, Construction Spending at 10:00 a.m. The S&P 500 futures contract trades within an intraday consolidation, following its Friday's volatility. The nearest important level of support is at 2,045-2,050, marked by Friday's local low. On the other hand, resistance level is at 2,070, marked by recent fluctuations. The market broke below its slightly descending short-term trading channel, as we can see on the 15-minute chart:
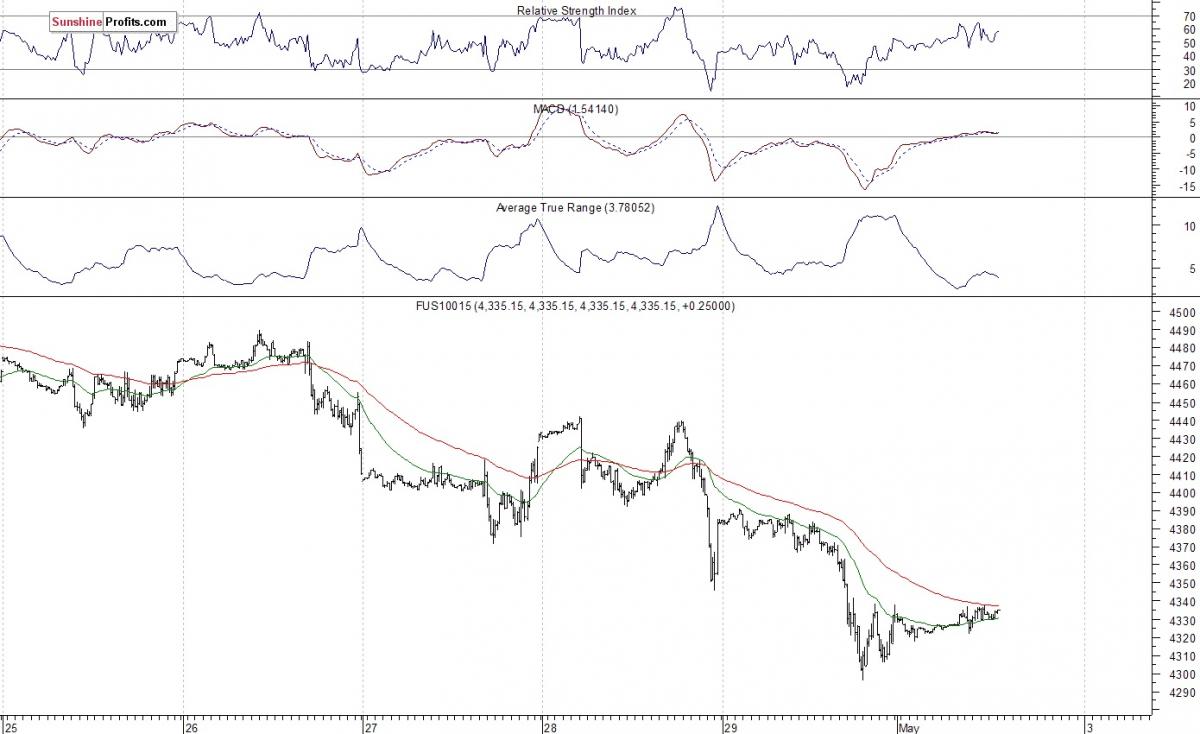
The technology Nasdaq 100 futures contract follows a similar path, as it trades within an intraday consolidation following Friday's move down. The nearest important level of support is at 4,290-4,300., and resistance level is at 4,330-4,350, among others. There have been no confirmed short-term positive signals so far. However, the market may be forming some bottoming pattern, as the 15-minute chart shows:
Concluding, the broad stock market extended its short-term move down on Friday. Is this a new downtrend or just consolidation following February - April rally? We still can see technical overbought conditions that may lead to uptrend's reversal or downward correction. However, there have been no confirmed negative signals so far. For now, it looks like a relatively flat correction within two-month-long medium-term uptrend. We prefer to be out of the market, avoiding low risk/reward ratio trades. We will let you know when we think it is safe to get back in the market.


