Update For The Silver To Gold Ratio


In early May of 2012, the Silver to Gold Ratio (SGR), or the number of ounces of silver that one ounce of gold will buy is looking really good. How is that? While it's true that from its lows of 32 last April, the ratio had retraced all the way back to 57 just last December, even this is nowhere near the ratio's highs reached during the 1980-2001 bear market in gold and silver, or even during the credit crisis crash of October 2008. This is a sign of strength in the precious metals.
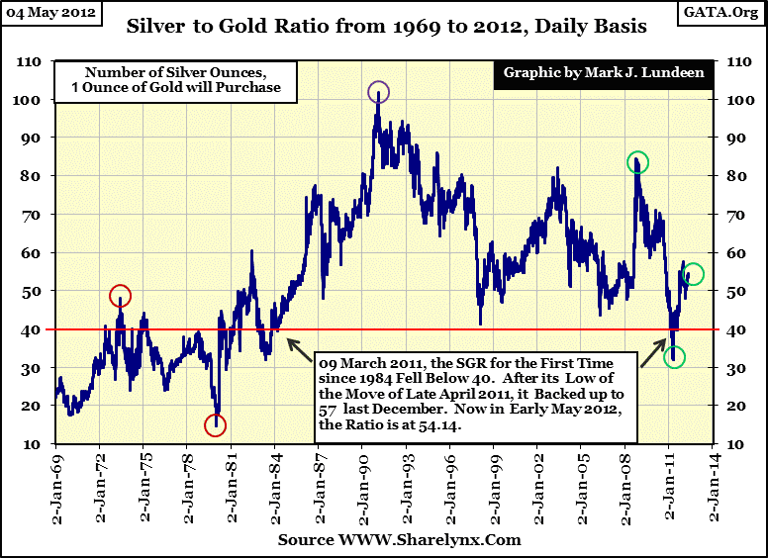
Why would that be? Well, during precious metals' bull markets, gold is usually the main topic of discussion, but historically silver has been the real money maker as it's the "poor-man's-gold." Today, many retail investors see $1,600 plus gold as simply unaffordable. However, for the price of an ounce of gold, precious metal investors today can purchase a hefty 53 ounces, or more than three pounds of silver. Emotionally, for most people of modest means, spending $1600 to invest in three pounds of silver rather than a single ounce of gold, is much more satisfying. And whether you are rich or poor, buying three pounds of silver today instead of an ounce of gold is the smart move. Historically, as precious metal bull markets progress, the SGR is forced down as swelling demand for silver from retail investors drives silver prices upward towards the price of gold, providing silver investors with a leveraged investment during a bull market in gold.
In the chart above I placed six circles on various points on the SGR chart. Using the SGR and the price of gold and silver from these key dates, I created the table below to illustrate the effects of changes in the SGR on the price of silver during bull and bear markets. Note in the table that the peaks and valley bottoms in the SGR do not correspondwith the absolute high or low prices in gold and silver.
During bear markets in precious metals, silver becomes a toxic asset as was the case from December 1979 - February 1991 (see table below). Silver declined by 89% as gold lost only 33%. That's a huge difference! But duringbull markets, this leverage works to the advantage of silver investors, as silver outperforms gold by a large margin. With the current SGR now significantly above 40, we are still in the early stages of a bull market in gold and silver. And with the SGR currently at 54 at the time of this writing, silver investors have plenty of leverage in the SGR to allow their investments in silver to outperform gold by 300% to 500% in the years to come.
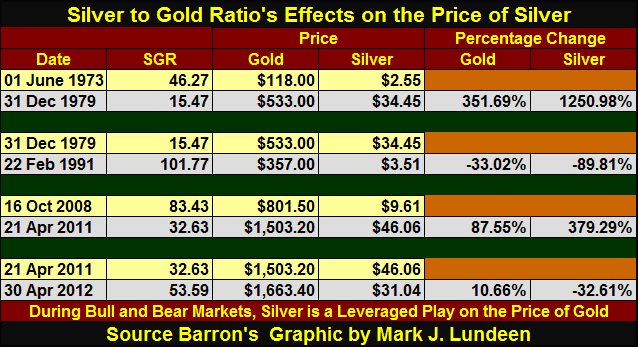
I know the past year has been a disappointment for silver investors, as is evident in the table above. But all bull markets have difficult periods that shake out weak hands. Just realize that silver bull markets can be very difficult on the psychological well-being of silver investors, as silver typically sees huge swings in price compared to gold. Let's look gold and silver's Bear's Eye View (BEV) charts to illustrate just how wild silver can be.
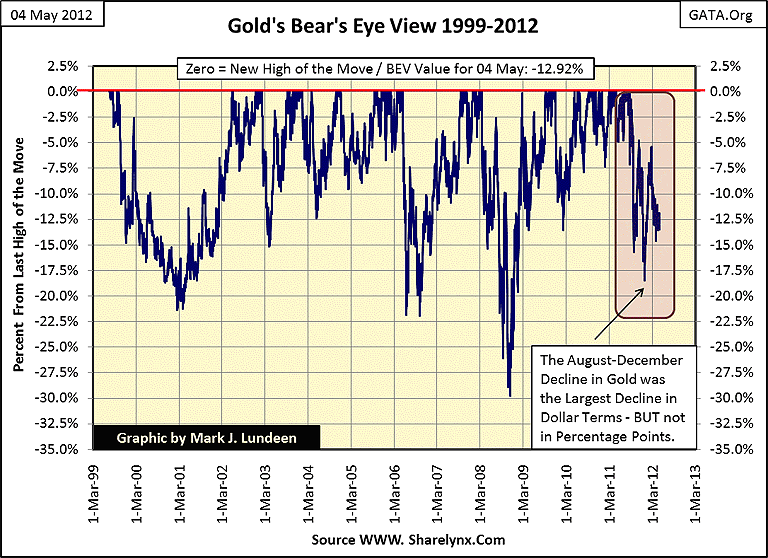
Below is gold's daily closing price BEV chart, where each new all-time high price is recorded as a Zero%. Other prices that are not a new all-time high are converted into negative percentage declines from their previous all-time high price. I call this charting technique the Bear's Eye View as this is exactly how Mr Bear sees the price of gold, or anything else. Each new all-time high is a big fat Zero to Mr Bear; he is only interested in how large a percentage he can claw back from the bulls' gains.
But just because each new all-time high in gold is a Zero percentage in a BEV chart, that doesn't mean gold hasn't moved up in price. It's just that a BEV chart converts price movements into percentages, displayed in a range between Zero% for a new all-time high, and -100% for a total wipeout of the investment. Mathematically, a BEV chart is incapable of showing price gains from one new high to another. So, for your information, the first BEV Zero in the chart below occurred on 19 July 1999 with gold at $253.70; the last BEV Zero occurred on 22 August 2012, with gold at $1888.70, a price increase of 644%. But remember, with the Bear's Eye View, all new highs are equal to Zero%, and never more. But that's okay since we are mainly interested in seeing how large a percentage Mr Bear has clawed back from the bulls' gains from one all-time high to the next.
Observing a market in percentage terms, restricted to a range of Zero% to -100%, provides an insight into the market unavailable to investors who focus solely on dollar advances and declines. For example, last Decemberthe gold market found itself in a state of panic as CNBC took great joy in reporting hourly that the price of gold had fallen a huge $348.8 from its highs of August, which was: "THE LARGEST DOLLAR DECLINE IN THE HISTORY OF GOLD!" Gold-bug suicide hotlines were manned 24 hours a day late last December. But gold's BEV chart told thereal story; last December's dollar decline may have been the largest in the history of gold, but it was also the smallest percentage correction in the price of gold since 1999! That's why I love Bear's Eye View charts!
Now let's look at silver's BEV Chart; note how silver doesn't trade like gold. Silver sees fewer BEV Zeros (new highs of the move) than gold, and its corrections are about twice as deep as gold's declines. Now, that really doesn't sound too good, does it? But remember, BEV charts are mathematically incapable of displaying the magnitude of advances in price.
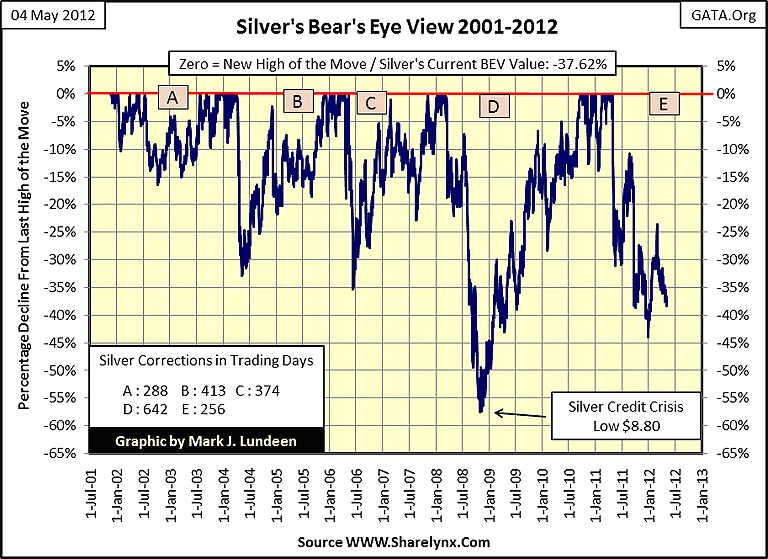
Amazingly, even with fewer new highs of the move (silver has yet to make a new all-time high since 1980) and deeper corrections, we see in the next chart that silver's gains have exceeded gold's during the current bull market, and have far surpassed the gains made by the Dow Jones at this point during its 1982-2000 bull market.
The chart below is easy to understand. The Dow Jones bull market began in 1982, and I started the beginning of the bull market in gold and silver in 2001. The chart's X-axis is not calibrated in dates, but in days after the start of the Dow's and gold and silver bull markets, even though the beginning of these bull markets are separated by two decades in time. Synchronizing the start dates in this chart allows us to directly compare the advances and declines of these two bull markets, day by day. As of this week, gold and silver's bull markets are in their eleventh year, placing them in August 1993 on the Dow Jones' 1982-2000 bull market timeline.
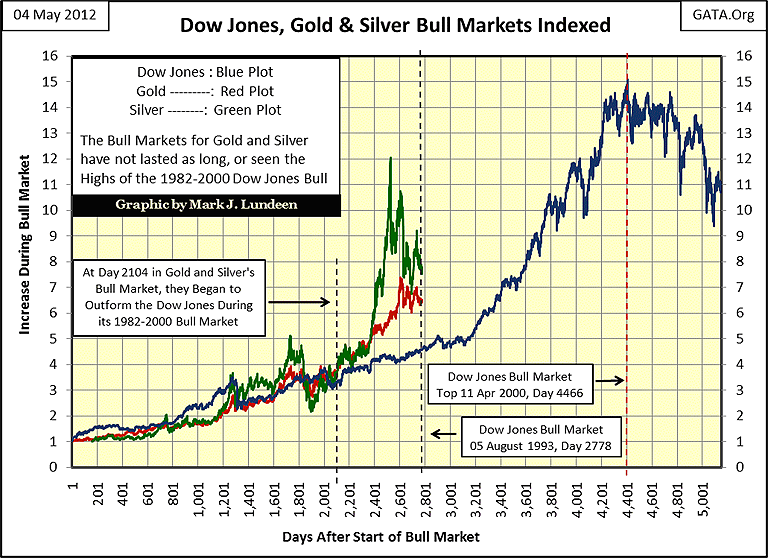
In August 1993, the Dow Jones bull had not yet increased by a factor of 5 from its start in August of 1982, yet no one in the financial media spoke ill of the bull market in stocks. And unlike our current bull market in gold and silver,eleven years after the start of the bull market in stocks, the investing public fully accepted that stocks were going higher, and kept sending more and more money to Wall Street to finance their retirements. But even though gold and silver have outperformed the 1982-1993 Dow Jones and the S&P500 by a sizeable margin for the past eleven years, the public has yet to take advantage of the powerful bull market in gold and silver. This, too, is another sign that we are still in the early stages of gold and silver's bull market, and that the largest profits are still ahead of us. Now is a time to buy, not sell the old monetary metals.
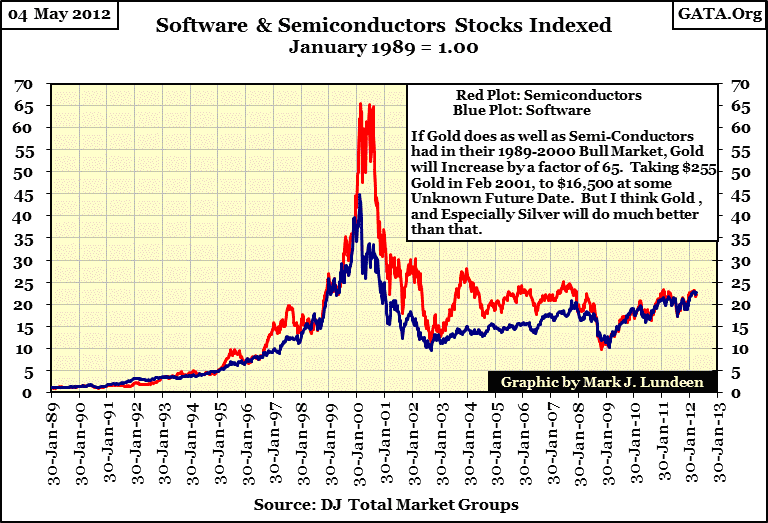
It would be a mistake to underestimate the potential gains for gold and silver by limiting them to the 1982-2000 Dow Jones bull market's gain of 15:1. At a minimum, I expect gold to do at least as well as the Dow Jones Total Market Group's Semiconductor index from 1989-2000, where semiconductor stocks increased by a factor of 65 by the year 2000, as seen below. And this only shows the gains semiconductor stocks made from 1989, not from the start of the stock market bull in 1982! I suspect that if the Dow Jones company had begun publishing this data in 1982, their semiconductor index would have shown gains double or triple those seen below. Maybe even more, since semiconductor stocks such as Intel and Texas Instruments had been hot stocks since the 1970s.
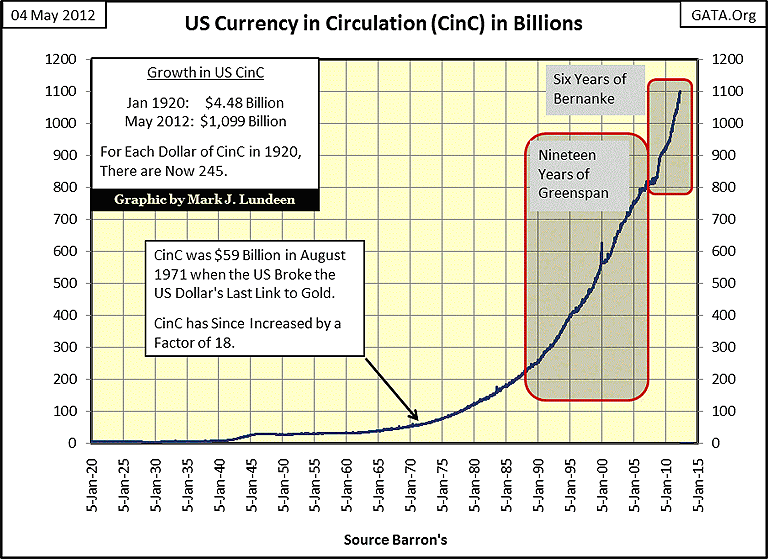
But semiconductor stocks are semiconductor stocks, and gold and silver are gold and silver. How can I look at apples, and conclude that oranges will do as well or better? Because both markets are priced in dollars! Greenspan's inflationary increase in the number of dollars in circulation is recorded in the box in the chart below. The driving force behind the 1989-2000 stock market bull, especially the high tech bull, was the Federal Reserve's printing press as seen below.
Anyone who remembers the late 1990s can recall those times when the stock market began teetering on the edge, and the entire financial media would reassure the market by talking about the "Greenspan Put" under the market. This was the strategy used by the Fed to lead people to believe they would guarantee the stock market's continued high valuations. Here are two quotes from authoritative sources to prove my point.
"The Fed could support the stock market directly by buying market averages in the futures market, thus stabilizing the market as a whole. --- The stock market is certainly not too big for the Fed to handle." - Robert Heller, former Governor of the Federal Reserve, From a 1989 WSJ interview.
***
"Well, what I just want to talk about for a few minutes is the various efforts that are going on in public and behind the scenes by the Fed and other government officials to guard against a free-fall in the markets...perhaps most important, there's been--the Fed in 1989 (note date of the quote above) created what is called a * PLUNGE PROTECTION TEAM *, which is the Federal Reserve, big major banks, representatives of the New York Stock Exchange and the other exchanges, and there--they have been meeting informally so far, and they have kind of an informal agreement among major banks to come in and start to buy stock if there appears to be a problem. They have, in the past, acted more formally" -- George Stephanopoulos, former Clinton adviser, September 17, 2001 on ABC's Good Morning America
As I've noted many times before, gold and silver * DO NOT * benefit from inflation; high-tech stocks and housing bubbles do. Bull markets in gold and silver begin when inflated financial markets begin to deflate, and they end when financial assets finally descend to their fair-market valuations; prices far below where stocks and bonds now find themselves. So, it's no accident that the bull market in gold and silver began in 2001, when the plunge-protection-team (as mentioned above by Stephanopoulos on Good Morning America) began their failed attempt to reflate the NASDAQ bubble. Currently, the world is being flooded with currencies from global central banks in a vain attempt to maintain the valuation of their grossly inflated financial assets, and real estate bubbles.
Ultimately, the purchasing power of this inflationary money will be greatly eroded. The reason to believe that today's fiat money will ultimately fail is as old as banking.
"Bankers know that history is inflationary and that money is the last thing a wise man will hoard." -- William Durant
We have only to note that currently some of the largest purchasers of gold are the same central banks who only fifteen years ago were the largest sellers of gold. What they sold for less than $400, central banks are now willing to spend $1600 to buy it back! So, it's a reasonable assumption that much of this inflation will ultimately flow into precious metals as wealth at risk seeks shelter in the old monetary metals. How high the prices of gold and silver could rise is anyone's guess. But I've predicted that gold will ultimately increase to $30,000, or more, because the global central banks will continue printing money to support their financial and real estate bubble valuations until their currencies fails to function as money.
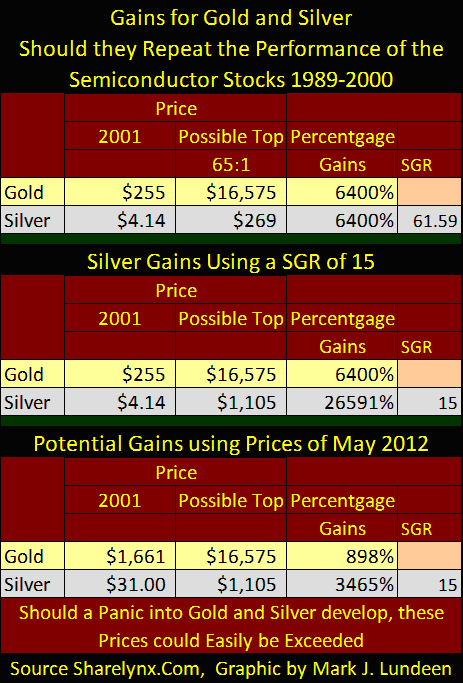
But it's too early to think of $30K gold just yet, so using semiconductor stocks for reasonable analog of what is possible, should gold repeat the 1989-2000 performance of the DJTMG's Semiconductor index of 65:1 (and it should!) that would take gold from $255 in 2001, up to $16,500. Here is a table with some "what if" assumptions in it. Note the effect on the price of silver should the SGR return to the 15 ounces of silver to one ounce of gold, a ratio last seen during the 1980 precious metals' peak. And if the SGR decreases to single digits; even at today's prices, silver could be one of the best investment opportunities of our generation.
Note for table below: Ignore the 2001 date for the third example, prices are for 2012.
With the coming troubles in Europe's banking system (and America's still later), I suspect we may see lower prices in gold and silver coming this summer, as was the case during 2008 with the US mortgage crisis. My reasoning is that the same banks having problems with their finances also have firm control over the paper gold and silver markets in New York and London. I expect these banks will do what they have to do to, to keep gold and silver from advancing strongly during a crisis in the global debt markets. But 2012 is not 2008, so I can't guarantee better: that is, lower prices to buy gold and silver in the next few weeks or months. But on Thursday, the near COMEX futures contract for silver had a $29 handle on it!
No matter what happens this summer, silver prices in the low $30 range are very attractive. Importantly, should the SGR once again see its lows of December 1979 (15.47), the gains in silver will be 346% greater than for gold. I, personally, would not be surprised to see the SGR dip into single digits before this bull market in gold and silver are over. If so, buying silver at today's prices just might be one of the greatest investment opportunities of our generation.
What's the best way to invest in silver? For most retail investors the best play is purchasing old junk grade US silver coinage minted before 1964, or silver eagles, and take your silver home. Twenty pounds of silver (320 ounces) just might become a life-changing investment. You may not get rich, but in the hard times ahead of us, you just may be able to pay your bills and keep food on the table thanks to twenty pounds in old silver coins.
Stay away from ETFs sponsored by the large Wall Street banks. If you're purchasing silver by the hundreds of thousands of dollars, Sprott Asset Management offers gold and silver ETFs I feel comfortable giving a tentative recommendation. The same goes with James Turk's Gold Money. I have nothing bad to say about them, I suspect they are wonderful vehicles for investing in gold and silver. But I lack the expertise to give them a strong recommendation, which is certainly no slight to Mr. Sprott or Turk's products. So if you have deep pockets, check them out. But for most people, just buy as much physical silver as you can afford, and hold on for the ride of your life.
More from Silver Phoenix 500


