US Dollar Remaining Strong


I have marked this chart with some shaded rectangular boxes that correspond to periods in which the Bollinger bands were contracting. For those who are not familiar with how to interpret the bands, when the width is widening out, volatility is increasing. Generally speaking, when a market is trending in one direction or the other, the bands will be widening. When a market is consolidating or moving sideways in a range, the bands will be contracting.
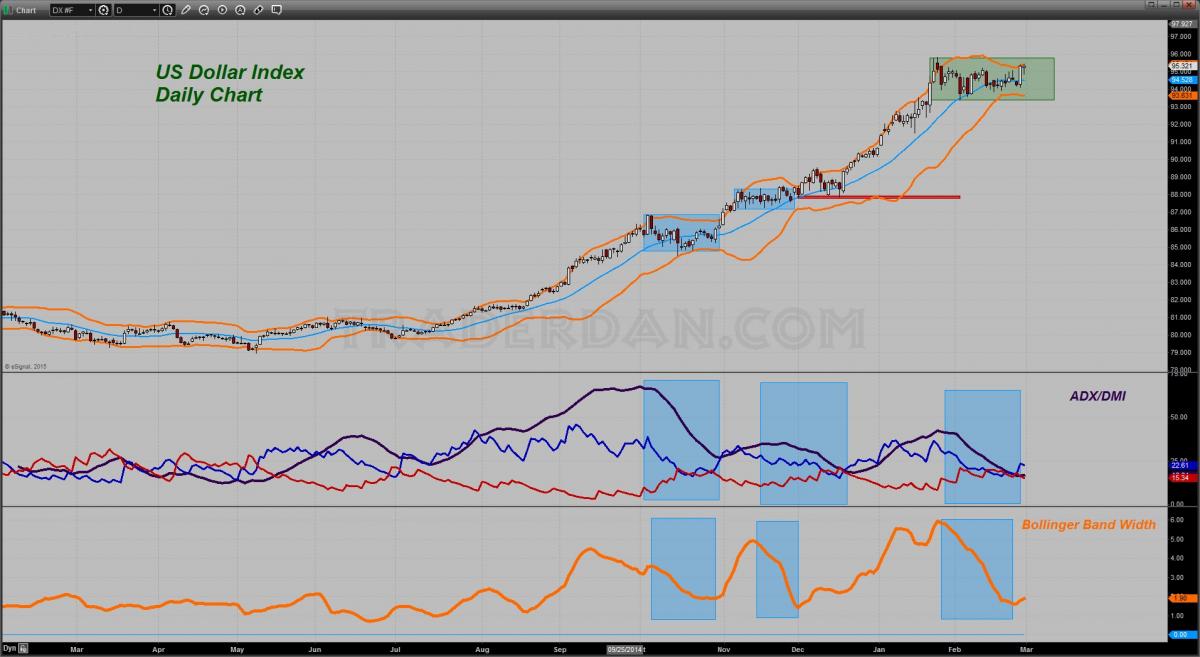
If you notice, during those periods in which the bands are constricting, the ADX line had turned down and was moving lower. If you recall, a falling ADX line indicates a market that is NOT in a trending phase but is rather in a consolidation or sideways phase.
The main thing I am attempting to portray with the Dollar is the fact the currency has been in a prolonged bullish trend, but that trend has been punctuated by periods of sideways movement. These periods seem to last between 3-4 weeks at a time after which, the greenback began another leg higher.

The commencement of the move higher was also accompanied by a widening out of the Bollinger Bands once more with the Bandwidth indicator turning higher.
I am noticing that the big move higher on Thursday of this past week, while not being of sufficient magnitude to take the Dollar outside of the recent range trade below 96, was strong enough to turn the Bandwidth indicator back up again. In other words, the bands are widening out once more hinting that the Dollar may very well be working on another fresh leg higher.
We will need to monitor this in the event that it does, since it should be enough to also turn the ADX line back up once more. That would be an additional confirmation that the trending move higher has returned.

The Dollar could possibly fail to extend past the top of the range near 96. However, there is no guarantee that it will. Remember – traders deal in probabilities, not certainties. If that were to occur, and the Dollar were to back down in the range once again, we would not want to see it violate the bottom of the range near 93.50 on a closing basis. That would more than likely flip the bandwidth indicator back down, which would raise some serious doubt about the ongoing bull move.

You might notice that back in December of last year, the Dollar broke out of the topside of that range noted, but then appeared ready to stall out as it set back once more instead of continuing a strong push higher. However, and this is important, the low made during that December retreat never fell below the low of the previous range (shaded rectangular area shown in November). For that matter, it managed to stay above the middle of the range before the buyers showed up and took it back up.
I am most interested in this chart because on Friday this week, we are going to get the payrolls data for the month of February. We will also be getting the ISM numbers midweek. There is a good chance that the Dollar will want to wait until Friday before making a major move. However, if the ISM manufacturing or services data happens to contain an upside surprise, the greenback may not wait until Friday. I simply do not know, which is why we have to wait and see.
What we do know however is that the Dollar is exhibiting some signs of potentially beginning another leg higher soon. That will be key for a host of commodities.
********
Courtesy of Trader Dan http://traderdan.com/
More from Silver Phoenix 500


