The US Geological Survey And Silver


 Recent talk on the Internet has been about Peak Gold, Peak Silver and a general view that the planet’s natural resources are in danger of sliding into an irreversible decline in production, which no amount of pricing or technology can reverse.
The implication of this for those who hold gold or silver would be immense in financial terms but also in wider political and economic terms. With that in mind, I consulted the statistics of the US Geological Survey (USGS) for subscribers in a recent newsletter and came to some interesting conclusions.
What I did not cover in that issue, but I do here, is an example of the quirkiness of the USGS which more often than not generates more questions than answers. I refer to their Reserve Base numbers for silver between the years of 1999 and 2002.
According to the USGS, the reserves estimate of a resource are the amount of silver that can be profitably extracted at current prices and the more expansive reserve base includes silver deposits that could become economical to mine if the price of silver was higher and/or production costs were lower due to improved technology, lower tax regimes or cheaper energy.
Now, an unexpected thing happened to the reserve base number for silver between 1999 and 2002 as shown on the graph below. They basically underwent a quantum leap as the base leapt from 420,000 to 570,000 tonnes for a 36% increase.
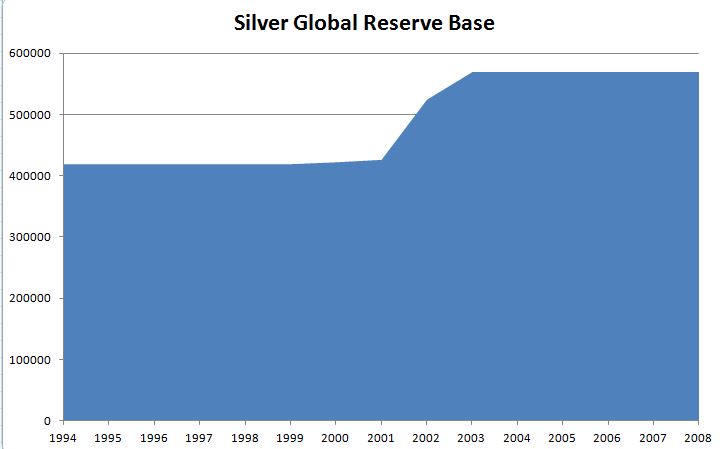
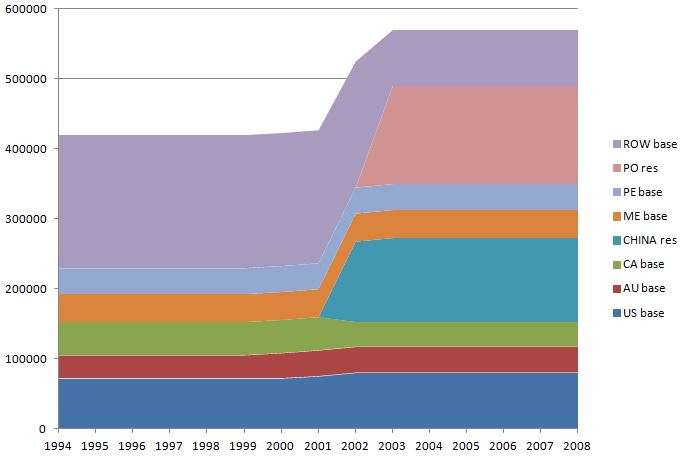
As I considered this leap in silver resources, I asked myself what merited such a transition after the global reserve base had flat lined for eight years. This in itself was curious as a resource estimate should not flat line while its reserve base is being mined out of the ground! In that light, I represent the same graph in terms of the reserve base estimates for each country.
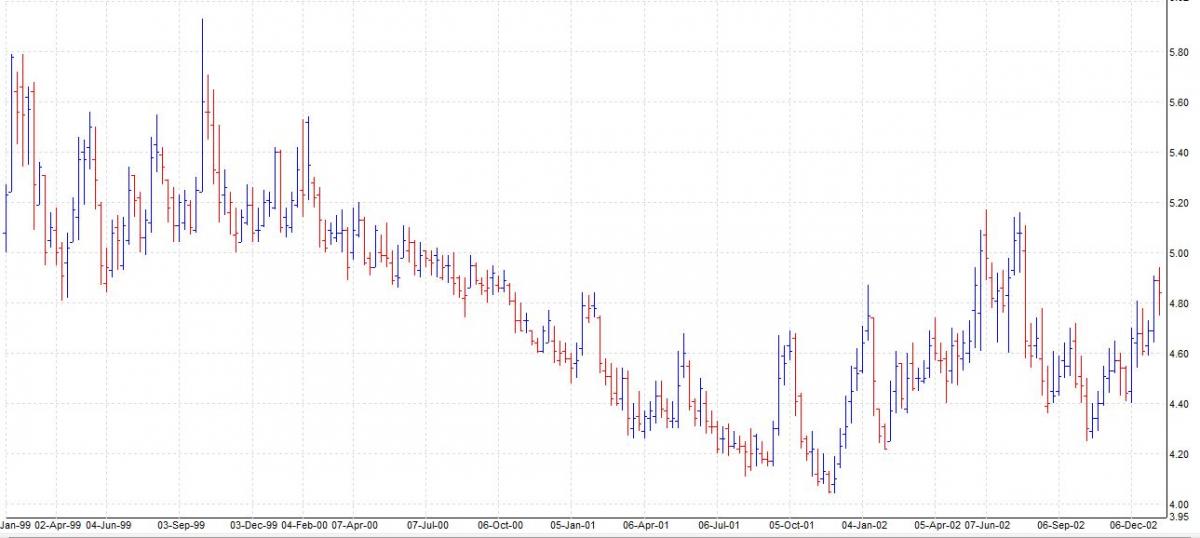
It looks like the USGS had decided to do something about the lack of reserve bases, but I am not completely sure how it all hangs together. As stated above, the reserve base can be influenced by various factors. So what about the price of silver over this period of 1999 to 2002? The argument would be that a higher silver price means more can be mined and so the reserve base can increase. But as the graph shows, silver was still in the throes of its 20 year bear market as the price grinded down further from $5.80 to $4.00 before recovering to $5.00. That did not seem a pretext for increasing the silver reserve base.
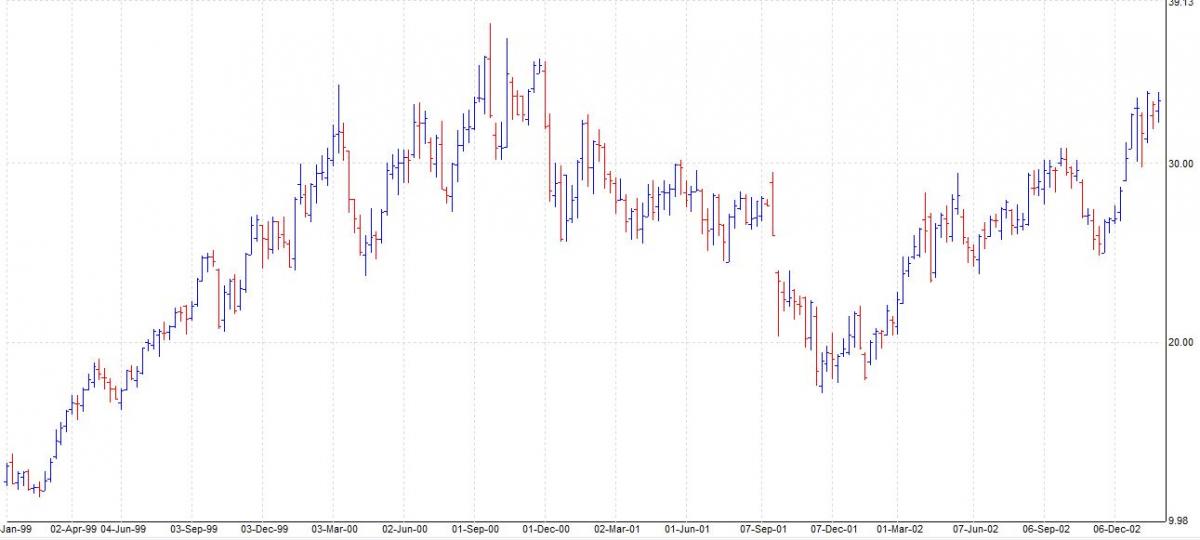
What about the price of energy? Did the price of crude oil decrease allowing production costs to come down and allow access to greater resources? As the graph for crude oil below shows, the price of oil did the opposite and nearly tripled in price to over $30 a barrel and pretty much stayed that way. This is again hardly a pretext to increase the silver reserve base.
As for technology advances in silver extraction, I cannot say with certainty what could have happened over that time period. But what I would say is that since silver is largely a byproduct of mining other metals such as lead, copper and gold, one would presume any technological advance would have to happen for these primary metals.
Again, I cannot speak to whether more favourable tax regimes could cause such a large increase in silver reserves. My educated guess is that such a tax situation would have to be large and global to get the figures we have here. In other words, it is not clear to me on what economic grounds this leap in silver tonnages was premised. My conclusion is it is not economic at all, but probably more political.
Much of the base uptick is down to China and Poland which out of the blue contributed an incredible 260,000 tonnes to the 570,000 tonnes. Now since these two were originally classed under ROW (Rest of the World), one wonders what the deduction for that region was. It turns out to far less at 110,000 tonnes. Some of the alterations to other countries are also interesting.
From 2000 to 2002, the US reserve base went from 72,000 to 80,000 tonnes for an 11.1% increase. Strangely, the Australian reserve base went from 33,000 to 37,000 tonnes between 1999 and 2001 for a 12.1% increase. I found it curious that two countries so far apart underwent almost the exact same increase in reserves in roughly the same time!
Also strange was the fact that the Canadian reserve base almost exactly wiped out the gains of Australia and the USA by dropping from 47,000 to 35,000 tonnes over 2000 for a 25.5% decrease.
However, since 2009, the USGS discontinued the reserve base estimates and concentrated on the smaller reserve numbers. Because of this, the old reserve base numbers are no longer relevant to the concept of Peak Silver today and I concentrated on the smaller reserve and production figures in my newsletter. But where they are relevant is in the strange machinations of the US Geological Survey that continue to this day.
********
Further analysis of silver can be had by going to our silver blog at http://silveranalyst.blogspot.com where readers can obtain subscription details for the Silver Analyst newsletter. Comments and questions are also invited via email to silveranalysis@yahoo.co.uk.
More from Silver Phoenix 500


