US Indexes Continue To Rally Within A Defined Range


This week ended with the S&P500, Dow Industrials and Nasdaq stalling near recent highs. From a technical perspective, both Thursday and Friday setup small range price bars (Doji candles or small Spinning Top type bars) after the upside price move on Wednesday. These are indicative of price consolidation and indecision.
The news events that initiated this rally, nearly a week ago, continue to drive sentiment in the markets. Yet the news from the ECB that new stimulus efforts would begin with $20 Billion Euros monthly invested in assets until they decide it is not required any longer suggests the EU is desperate to support extended growth and some renewed inflation. This move by the EU pushed banks and the finance sector higher while the US stock market stalled near the end of the week.
At these lofty levels, almost all of our indicators and predictive modeling systems are suggesting the US stock markets are well within an overbought mode. Of course, the markets can continue in this mode for extended periods of time as central banks and external efforts to support the asset/stock market continues, at some point investors/traders will recognize the imbalance in price/demand/supply as a fear of a price contraction.
We are very cautious that the market is setting up a lofty peak at this time. It is important for traders and investors to understand the global situations that are setting up in the markets. With precious metals moving higher, it is important to understand that FEAR and GREED are very active in the markets right now. The continued capital shift that has been taking place where foreign investors are shifting assets into US and more mature economies trying to avoid risks and currency risks is still very active. Yet the lofty prices in certain segments of the US stock markets means that this capital shift may take place where investment capital is shifted away from more risky US assets (high multiple speculative stocks) and into something that may appear to be undervalued and capable of growth.
The shifting focus of the global markets, the EU and the continued need for stimulus at this time is somewhat concerning. Our view is to watch how the global markets play out and to maintain a cautious investment strategy. We shifted into an extremely cautious mode back in February/March as the US market completed the October/December 2018 breakdown and precious metals started a move higher. We continue to operate within this extremely cautious investment mode because we believe the foundation of the global markets are currently shifting and we don't believe the stability of the markets is the same as it was after the February 2017 market collapse.
What do we believe is the result of this shift in our thinking? This is very simple. We are entering into the final 13+ months of the US presidential election cycle, the trade wars between the US and China continue to drag on with is muting economic activity, the EU continues to battle to find some growth/inflation while Great Britain attempts to work out a BREXIT deal as soon as possible. Meanwhile, we continue to try to find opportunities in the markets with these extreme issues still pending. We don't believe any real clarity will happen until we near October/November 2020. Be sure to opt-in to our Free Trade Ideas Newsletter to get more updates.
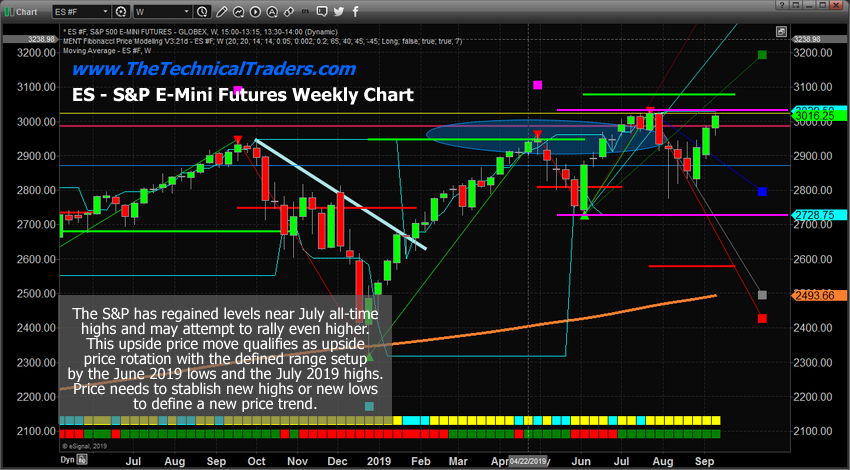
This ES Weekly chart highlights the range-bound price rotation that currently dominates the US stock market. Overall, the US stock market and the economy are much stronger than any other economy on the planet. The risk factor is related to the fact that the capital shift which has been pushing asset prices higher as more and more capital flows in the US stock market may have reached a point of correction (headed into the US presidential election cycle). As long as price stays within this range, we believe continued extreme volatility will continue. Our Fibonacci system suggests price must close above 3178 to qualify as a new bullish trend and/or close below 2577 to confirm a new bearish trend.
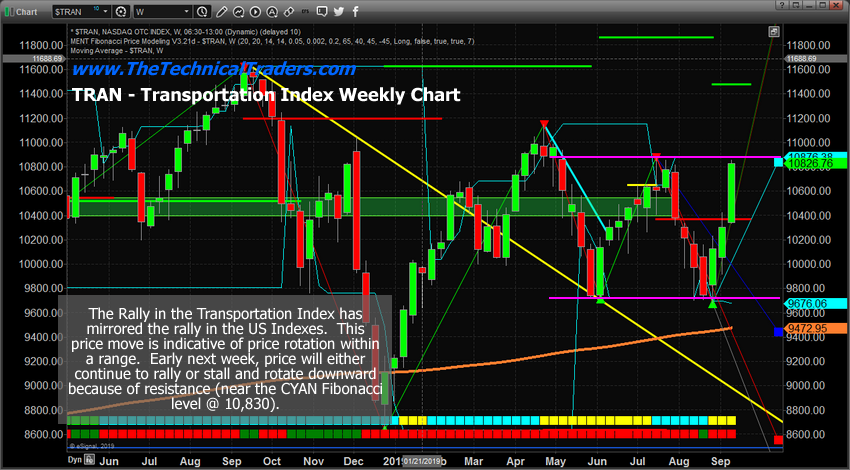
This Transportation Index weekly chart shows a similar setup. Although the Fibonacci price trigger levels are vastly different. Price would have to climb above 11,475 to qualify for as a new bullish trend whereas it would only have to fall below 10,371 to qualify as a new bearish trend. Given the past rotation levels, it is much more probable that price may rotate into a bearish trend before attempting to reach anywhere near the bullish price trigger level.
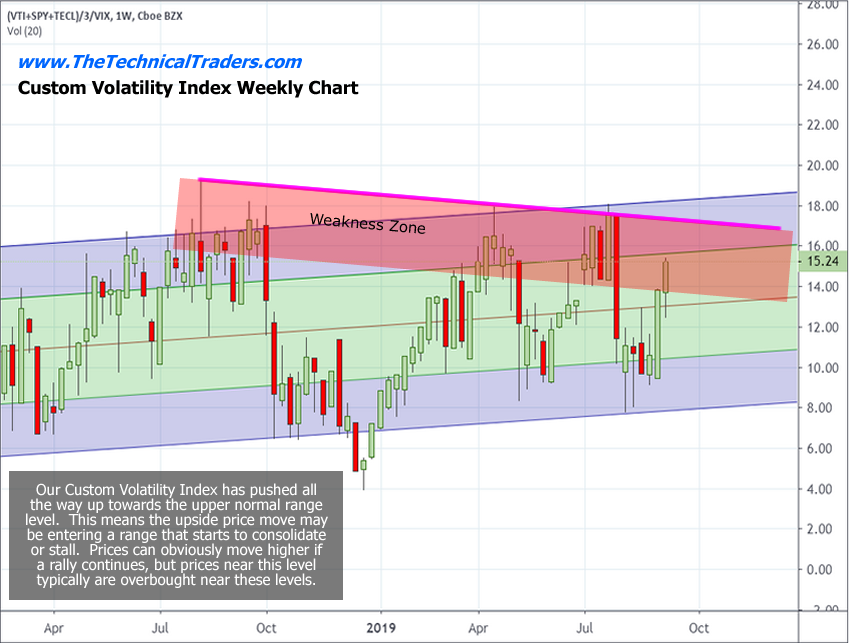
Our Custom volatility index suggests price has rallied last week well into the upper “weakness zone”. This move suggests the upside price move may already be well into the overbought levels (again) and may begin to stall. Traders need to be cautious near these level. We continue to suggest that skilled technical traders should look to pull some profits from these lofty levels to protect cash/profits. Any extreme volatility and/or a bigger price rotation could be disastrous for unprepared traders.
We are excited to see what happens early next week. News will be a big factor – as it always is in this world. Pay attention to how the markets open early this week and keep your eyes open for any crisis events (wars, bombings or other geopolitical news). And get ready for some really big volatility to hit the global markets.
This is the time for skilled technical traders to really shine as these bigger moves roll on.
As a technical analysis and trader since 1997, I have been through a few bull/bear market cycles. I believe I have a good pulse on the market and timing key turning points for both short-term swing trading and long-term investment capital. The opportunities are massive/life-changing if handled properly.
So, if you believe in technical analysis, then this is the newsletter and market condition for you to really shine, especially with my trading indicators coming online.
Be prepared for these price swings before they happen and learn how you can identify and trade these fantastic trading opportunities in 2019, 2020, and beyond with our Wealth Building & Global Financial Reset Newsletter.
Join me with a 1 or 2-year subscription to lock in the lowest rate possible and ride my coattails as I navigate these financial market and build wealth while others lose nearly everything they own during the next financial crisis.
I can tell you that huge moves are about to start unfolding not only in currencies, metals, or stocks but globally and some of these supercycles are going to last years. A gentleman by the name of Brad Matheny goes into great detail with his simple to understand charts and guide about this. His financial market research is one of a kind and a real eye-opener. 2020 Cycles – The Greatest Opportunity Of Your Lifetime
FREE GOLD OR SILVER WITH SUBSCRIPTION!

********

Chris Vermeulen has been involved in the markets since 1997 and is the founder of Technical Traders Ltd. He is an internationally recognized technical analyst, trader, and is the author of the book: 7 Steps to Win With Logic
Through years of research, trading and helping individual traders around the world. He learned that many traders have great trading ideas, but they lack one thing, they struggle to execute trades in a systematic way for consistent results. Chris helps educate traders with a three-hour video course that can change your trading results for the better.
His mission is to help his clients boost their trading performance while reducing market exposure and portfolio volatility.
He is a regular speaker on HoweStreet.com, and the FinancialSurvivorNetwork radio shows. Chris was also featured on the cover of AmalgaTrader Magazine, and contributes articles to several financial hubs like MoneyShow.com.
More from Silver Phoenix 500


