USD Index At Fresh Lows


Earlier today, the USD Index extended losses against the basket of the major currencies as yesterday's Fed statement didn't give clear signal on the timing of its next rate hike. How did this drop affect the technical picture of EUR/USD, USD/CAD and AUD/USD?
In our opinion, the following forex trading positions are justified – summary:
EUR/USD: none
GBP/USD: none
USD/JPY: none
USD/CAD: none
USD/CHF: none
AUD/USD: none
EUR/USD
Quoting our previous alert:
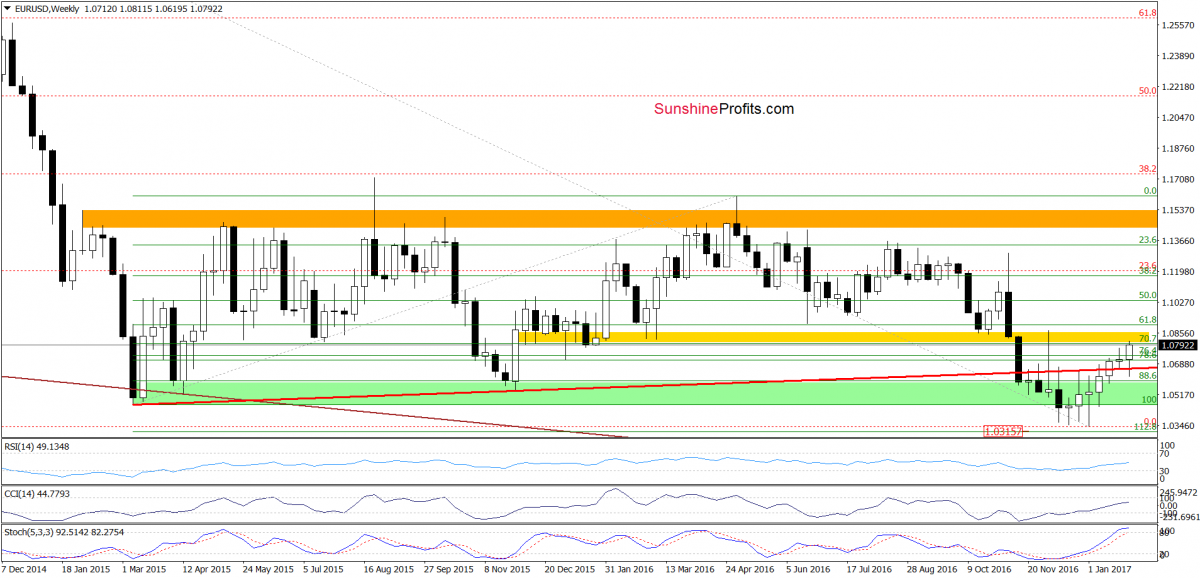
(...) EUR/USD reached the yellow resistance zone, approaching the 50% Fibonacci retracement. What's next? Taking into account the fact that the proximity to this resistance area was enough to trigger a pullback in the previous week, it seems that we'll see a similar price action and a verification of a breakout above the lower border of the blue rising trend channel in the very near future.
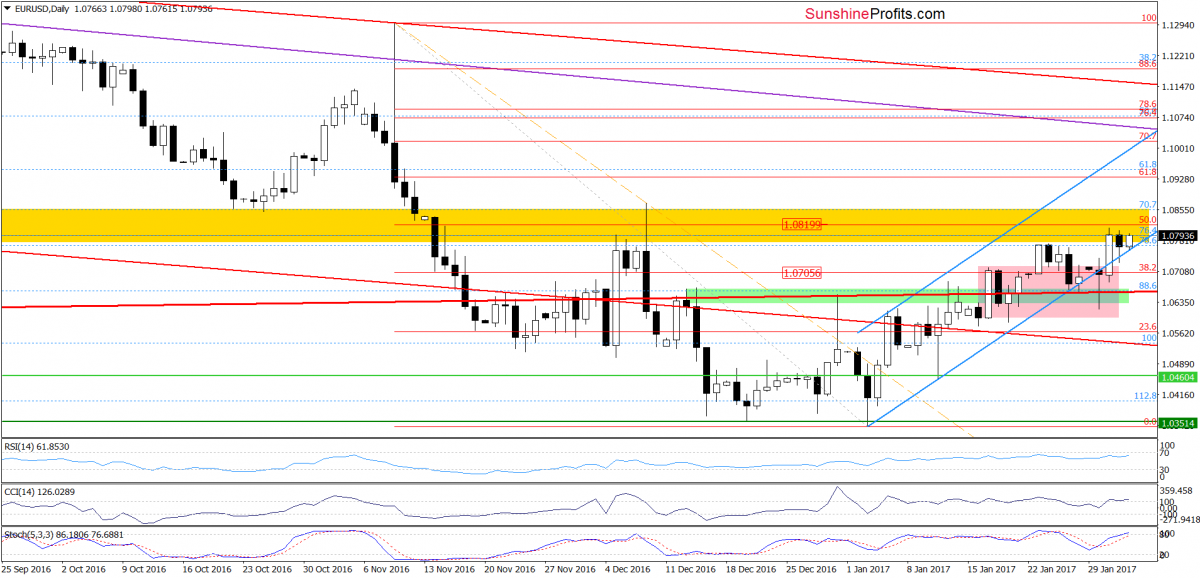
Looking at the daily chart, we see that the situation developed in tune with the above scenario and EUR/USD verified the earlier breakout above the lower border of the blue rising trend channel. What does it mean for the exchange rate? We believe that the best answer to this question will be the quote from our yesterday's commentary:
(...) we should keep in mind that as long as there is no drop below this support another upswing and a test of the upper border of the yellow resistance zone is likely – especially when we factor in the fact that the buy signals generated by the weekly and daily indicators are still in play.
Very short-term outlook: mixed with bullish bias
Short-term outlook: mixed
MT outlook: mixed
LT outlook: mixed
Trading position (short-term; our opinion): No positions are justified from the risk/reward perspective.
USD/CAD
On Friday, we wrote the following:
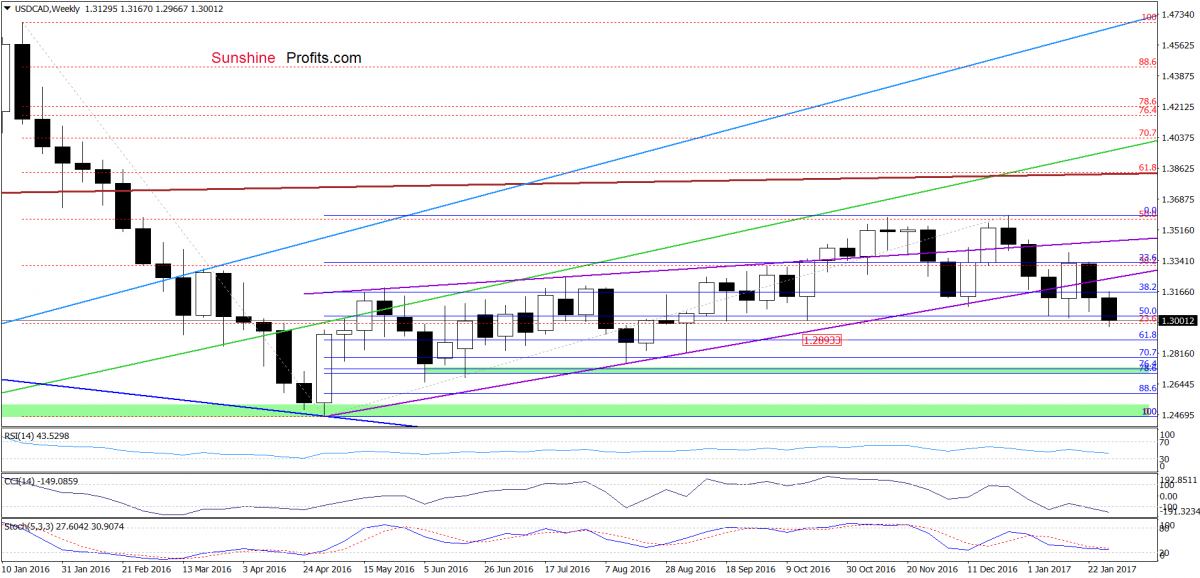
(...)Although the pair rebounded in recent days, the exchange rate still remains under the previously-broken lower purple resistance line, which suggests that the current upswing could be nothing more than a verification of the earlier breakdown. Additionally, (...) the sell signals generated by the weekly indicators remain in place suggesting lower values of USD/CAD in the coming days. If this is the case and the exchange rate declines from here, (...), it seems that the exchange rate will move lower once again and test the lower border of the blue rising tend channel (seen on the daily chart) in the coming days.
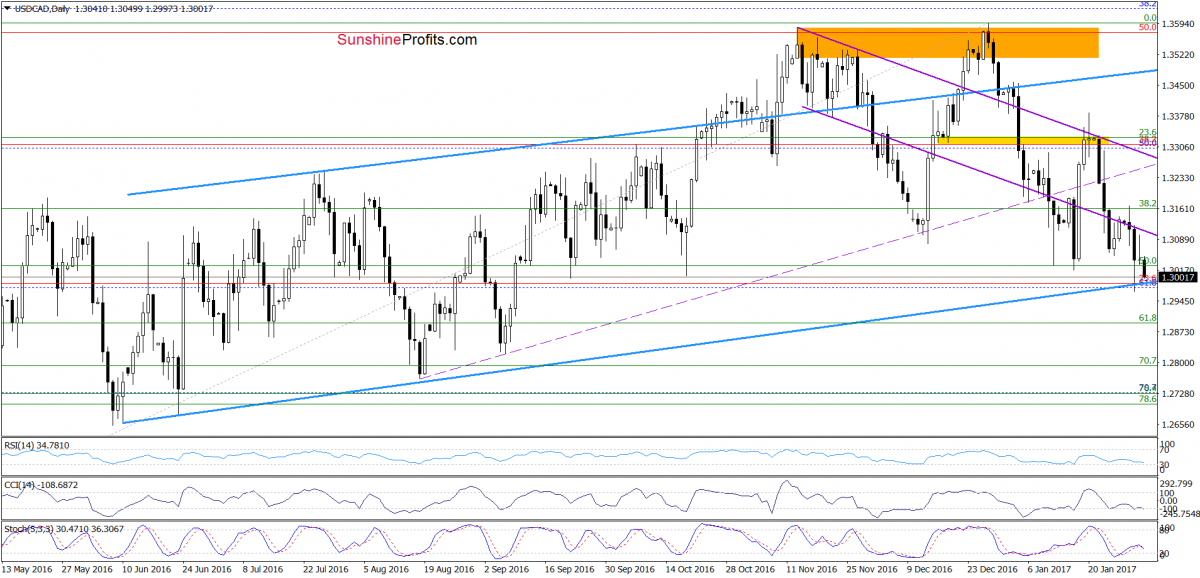
On the daily chart, we see that currency bears pushed USD/CAD lower (as we had expected) and the pair slipped to our downside target. Although the exchange rate rebounded yesterday, the previously-broken lower border of the purple declining trend channel encouraged currency bears to act, which resulted in a pullback. Earlier today USD/CAD extended losses, which suggests a re-test of the blue support line. At this point it is worth noting that the Stochastic Oscillator generated a sell signal, which suggests that the bears could try to push the pair even lower. If this is the case and the exchange rate drops under this support line, the next downside target for the sellers will be around 1.2893, where the 61.8% Fibonacci retracement based on the entire May-December upward move is.
Very short-term outlook: bearish
Short-term outlook: mixed
MT outlook: mixed
LT outlook: mixed
Trading position (short-term; our opinion): No positions are justified from the risk/reward perspective.
AUD/USD
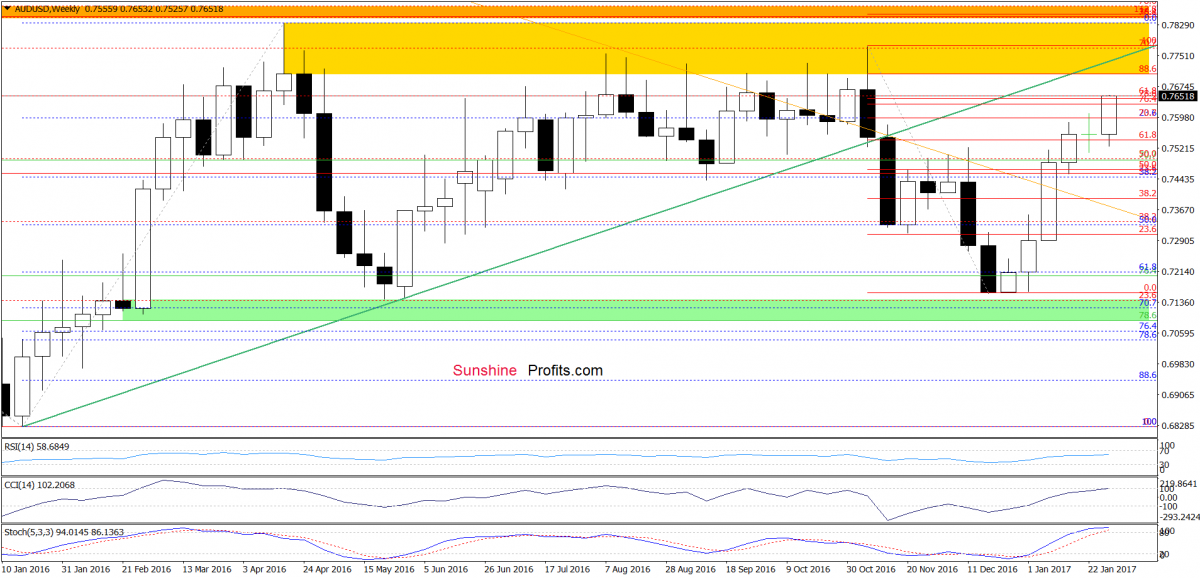
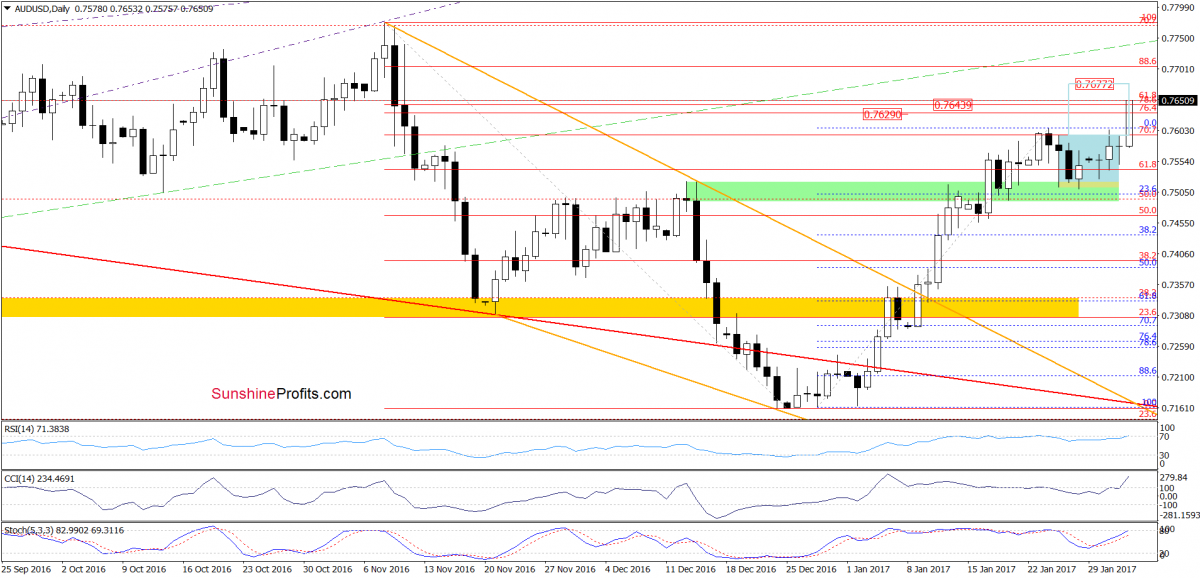
Looking at the daily chart, we see that AUD/USD broke above the upper border of the blue consolidation earlier today, which means that our Tuesday's commentary on this currency pair is up-to-date also today:
(...) taking into account the buy signal generated by the Stochastic Oscillator, it seems that currency bulls will try to push the pair higher in the coming days. If this is the case, and the exchange rate breaks above the upper border of the consolidation, we'll see not only a test of the recent highs, but also an increase to the resistance zone created by the 76.4% and 78.6% Fibonacci retracement levels (around 0.7629-0.7643). If this area is broken, the next target will be around 0.7677, where the size of the upward move will correspond to the height of the blue consolidation.
Finishing today's commentary please keep in mind that as long as there are no sell signals further improvement is likely. Therefore if AUD/USD climbs above 0.7677, the next upside target will be the yellow resistance zone marked on the weekly chart.
Very short-term outlook: bullish
Short-term outlook: mixed
MT outlook: mixed
LT outlook: mixed
Trading position (short-term; our opinion): No positions are justified from the risk/reward perspective.
More from Silver Phoenix 500


