Weekly Gold, Silver, Oil & Natural Gas Analysis
 share
share
 share
share
 share
share
 share
share
 share
share
Last week was nothing special as stock market continued to drift higher on light volume and the Volatility Index (VIX) reaching a new multi year low. This mix of higher prices on light volume, multi year lows in the VIX and an overbought market paints a clear picture to a market technician - Be Ready for a Pullback!
Last Wednesday I sent out a report covering sector rotation comparing the price performance of these sectors from the January peak with last weeks price action. It was very interesting and it pointed to a sharp sell off Thursday or Friday
Here is last Wednesday's report if you are interested: https://www.gold-eagle.com/editorials_08/vermeulen031810.html
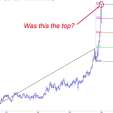
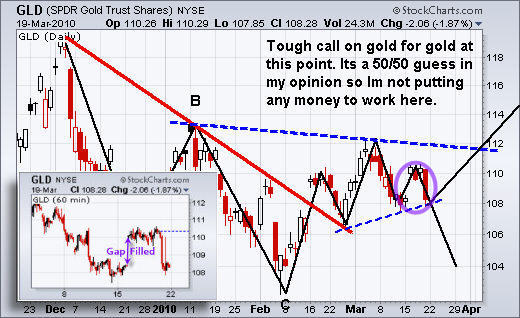
GLD Gold ETF Daily & 60 Minute Chart
Last week gold gap higher then traded sideways for a few days. I will admit it was very tempting to buy into the move but I stuck with my trading strategy which is to not chase moves which gap in my direction.
Gaps are known to get filled about 70% of the time. What that means in this situation is that the price will most likely sell back down to fill that gap before trying to move higher.
All that said the problem I see now on the daily chart is the possibility of the mini Head & Shoulders pattern breaking down. If gold moves any lower then I would expect a sharp pullback. The measured move would equal a pullback to the $104 area on the GLD chart and the $1070 level for spot gold.
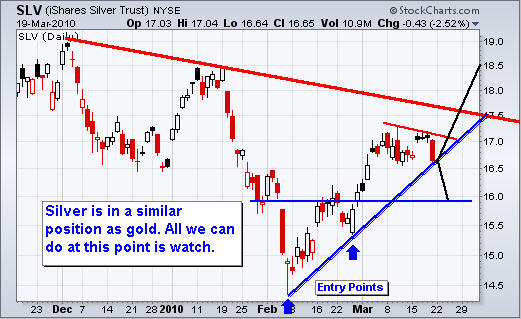
SLV Silver ETF Trading Chart
The silver chart looks much different than gold's but in reality they are trading in a similar situation. If silver moves any lower then sellers will flood the market and take the price down to the next support level. But if we get a bounce then it should surge and rally almost a $1 per ounce from this point.
Only time will tell as we let this trade unfold with a stop at $16.52.
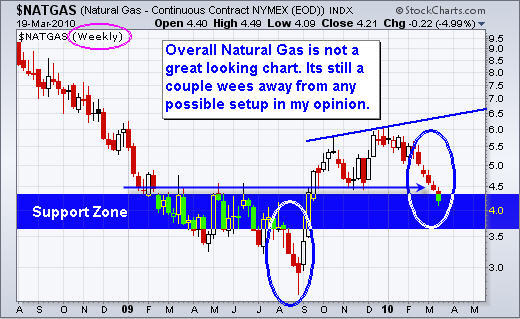
Natural Gas - Weekly Trading Chart
Natural gas has been selling down for almost 2 months. The chart is starting to show a possible buy point if all goes well in the next few weeks.
What I like about this chart is that we saw a break of a support level and heavy selling which tells me the general herd is getting shaken of their long positions. This extended sell off is now entering a support zone and could provide us with a low risk setup in the next 2-3 weeks.
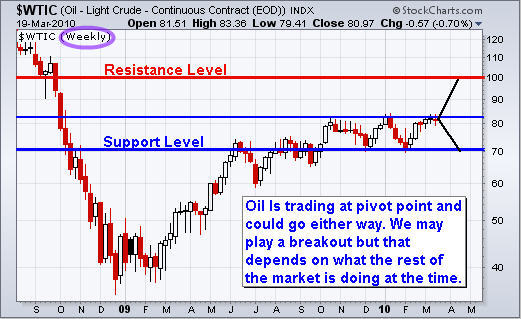
Crude Oil - Weekly Trading Chart
Oil is trading similar to gold and silver. It is trading at a key pivot point and could go either way quickly. I will be keeping my eye on the daily and 60 minute charts for a possible low risk entry point.
Weekend Stock & Commodity Trading Conclusion
In short, the overall market is trading at level were there is not much to we can do. Day traders are able to take advantage of this price action but not swing traders.
I feel the major indexes have another 1-2 down day left in them before a bounce, but it's more difficult to gauge the momentum with a cool down period in the middle of it all (the weekend).
The market is on the edge of some exciting moves as I can feel something brewing. With any luck there could be some great opportunities in the coming days.
share
share
share
share
share

Chris Vermeulen has been involved in the markets since 1997 and is the founder of Technical Traders Ltd. He is an internationally recognized technical analyst, trader, and is the author of the book: 7 Steps to Win With Logic
Through years of research, trading and helping individual traders around the world. He learned that many traders have great trading ideas, but they lack one thing, they struggle to execute trades in a systematic way for consistent results. Chris helps educate traders with a three-hour video course that can change your trading results for the better.
His mission is to help his clients boost their trading performance while reducing market exposure and portfolio volatility.
He is a regular speaker on HoweStreet.com, and the FinancialSurvivorNetwork radio shows. Chris was also featured on the cover of AmalgaTrader Magazine, and contributes articles to several financial hubs like MoneyShow.com.