Is This What Falling Through The Floor Looks Like In Stocks?


While last week brought us higher stock prices, Thursday and Friday were bad days for the bulls. And little wonder, as the technical deterioration continues to play out. Looking at both the closing prices on Friday and today’s premarket action, how close to the end in this correction are we?
Let’s check yesterday’s price action in the weekly chart’s context (charts courtesy of http://stockcharts.com).
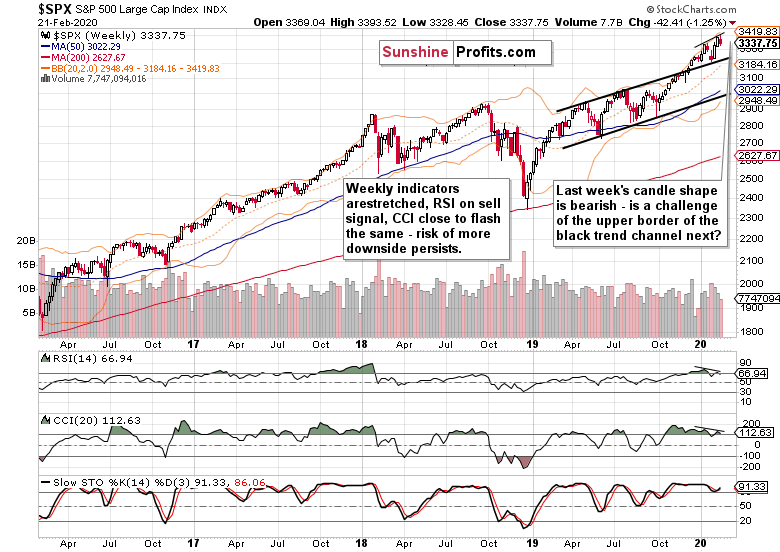
After two weeks of strong gains, the bulls just couldn’t keep up the momentum. New highs reached evaporated faster than you can blink. Yet why the bearish tone when stocks closed still comfortably above the upper border of the rising black trend channel?
The answer lies in the weekly indicators. It’s not only that they’re stretched, but the RSI went on its sell signal and the CCI is very close to doing the same.
Now, let’s compare the levels of both of these indicators with the price action. Stocks have been rising while both the RSI and CCI made lower highs. You can see it marked on the above chart with thin black lines. We have two divergences here – in other words, they didn’t confirm the price advance.
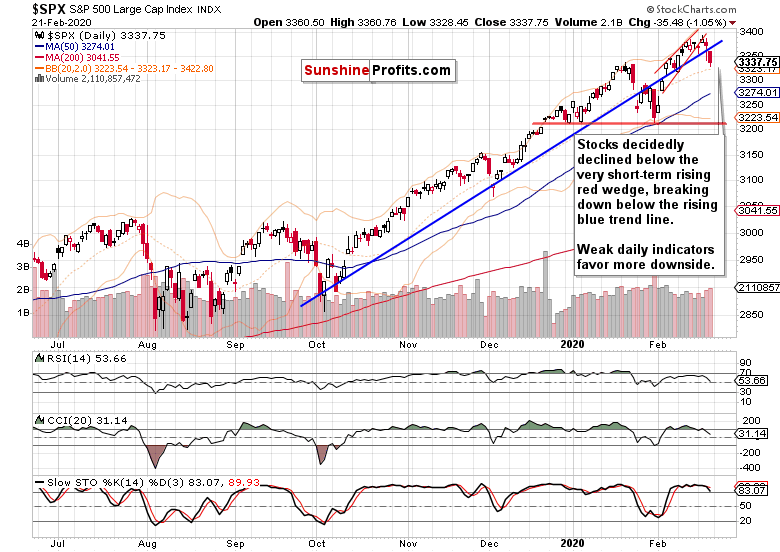
The daily chart reveals the deterioration in more detail. The very short-term rising red wedge predictably didn’t contain the price action. Neither did the rising blue trend line, and stocks closed on Friday not too far from the session lows.
While the breaskdown below the blue trend line isn’t confirmed yet, the increasing volume on the downswing days coupled with the bearish positioning of the daily indicators, makes the confirmation very likely to materialize.
Both the daily RSI and CCI have been pointing lower, and Stochastics with its sell signal will likely soon leave its overbought area, which would increase the sell signal’s reliability. Please also note that throughout the February advance, the daily indicators have been slowly losing breath, and not confirming higher prices – in other words, they’ve been diverging just like the weekly indicators.
Let’s examine the market breadth indicators in the very short-term.
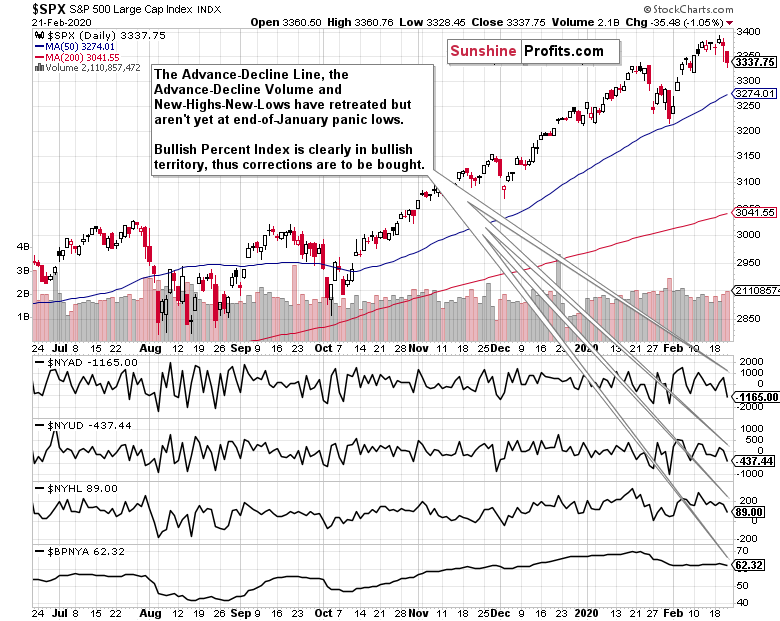
The recent downswing can be clearly seen in the advance-decline line, the advance-decline volume and new highs minus new lows – they’re all pointing lower. Their values however haven’t yet moved to the panic lows reached at the end of January. That also indicates there’s more downside to come.
At the same time though, the bullish percent index remains well above 50%, indicating prevailing buying interest. In other words, we’re still in a bull market.
What about volatility – has it reached or at least approached its recent extremes already? Let’s check the VIX.
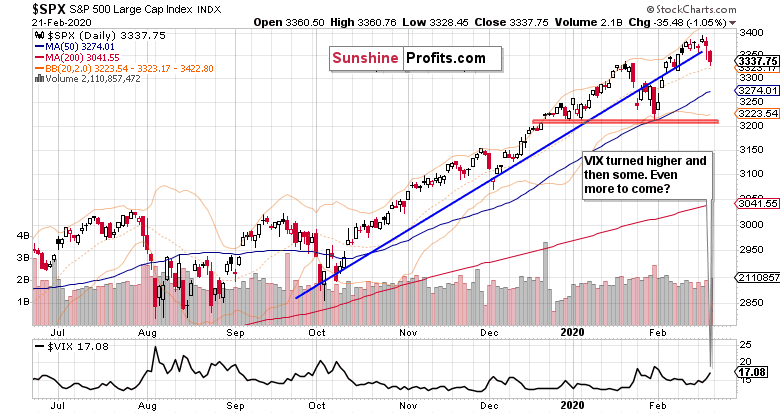
As the bulls stumbled, the volatility measure started turning higher and higher. So far, it still remains below its January high though. Will it reach this reading, or even overcome it?
It’s almost a sure bet it will. As the stock futures trade around 3250 currently, it means they’ll open with a sizable bearish gap of almost 90 points. That spells acceleration on the downside. Hands up if you just thought of the Wall Street adage “buy when there’s blood in the streets”.
But should it reach that far, where is the downswing likely to meet an important support? Enter the red support zone that is formed by the December bullish gap, late-December and early-January lows. It has already stopped the slide at the end of January. By the way, that’s reinforced by the proximity of the upper border of the rising black trend channel on the weekly chart.
Taking into account all of the above, it’s our opinion that a favorable moment to enter on the long side is fast approaching. This correction has entered its highly volatile phase, and doesn’t appear to be over yet. In order to take advantage of the likely downside momentum continuation, we’re placing a limit buy order at … (the exact price point is reserved for our subscribers). Both the daily and weekly charts show strong support there.
Downside moves during bull markets are here to either scare you out, or wear you out. This is the formed case. Let’s remember the big picture though – we’re in a stock bull market, actually the longest-running one, and there’re sizable gains ahead to enjoy down the road.
Summing up, the medium-term S&P 500 outlook has deteriorated, and more downside remains probable. This is also apparent on the daily chart. It’s the breakdown first below the rising wedge, then below the rising support line. There’re also notable divergencies between RSI, CCI and stock prices. Coupled with the volatility examination and today’s bearish gap, it points to more to come in this correction before it’s over. Yet, we’re of the opinion that a favorable setup is approaching to get back in on the long side to reap more fruits of this stock bull market. It remains intact and much higher prices are to come. Our aim is to let the many bullish factors in this stock bull market keep working to our benefit.
We encourage you to sign up for our daily newsletter- it's free and if you don't like it, you can unsubscribe with just 2 clicks. If you sign up today, you'll also get 7 days of free access to our premium daily Stock Trading Alerts as well as our other Alerts. Sign up for the free newsletter today!
Monica Kingsley
Stock Trading Strategist
Sunshine Profits - Effective Investments through Diligence and Care
* * * * *
All essays, research and information found above represent analyses and opinions of Przemyslaw Radomski, CFA and Sunshine Profits' associates only. As such, it may prove wrong and be subject to change without notice. Opinions and analyses were based on data available to authors of respective essays at the time of writing. Although the information provided above is based on careful research and sources that are believed to be accurate, Przemyslaw Radomski, CFA and his associates do not guarantee the accuracy or thoroughness of the data or information reported. The opinions published above are neither an offer nor a recommendation to purchase or sell any securities. Mr. Radomski is not a Registered Securities Advisor. By reading Przemyslaw Radomski's, CFA reports you fully agree that he will not be held responsible or liable for any decisions you make regarding any information provided in these reports. Investing, trading and speculation in any financial markets may involve high risk of loss. Przemyslaw Radomski, CFA, Sunshine Profits' employees and affiliates as well as members of their families may have a short or long position in any securities, including those mentioned in any of the reports or essays, and may make additional purchases and/or sales of those securities without notice.
********

Monica Kingsley is a trader and financial markets analyst. Checking dozens of charts daily, she integrates their messages with economics and in-depth experience. Trade calls and writing are her cup of tea as much as studies in market histories. Having been at the financial markets when the Great Recession arrived, she experienced many bull and bear markets - be it in stocks, bonds, gold and silver. https://www.monicakingsley.co
More from Silver Phoenix 500


