What Headwinds? Airlines To Book Their 10th Straight Year Of Profitability


Domestic airlines weren’t exempt from the rout that hit stocks in December, the market’s worst month since the Great Recession. Shares of all four major U.S. carriers—American, Delta, United Continental and Southwest—saw double-digit losses. Delta ended December down 17.8 percent, its worst month since October 2009, when it gave back 20.3 percent.
The losses appeared to extend into the new year. On January 3, Delta forecast slightly slower revenue growth on concerns of a global economic slowdown, not to mention the partial U.S. government shutdown. In its first month, the shutdown—which ended Friday as President Donald Trump signed a bill to extend spending for three weeks—cost the U.S. aviation industry about $105 million, according to consulting firm ICF. Delta’s stock lost almost 9 percent for the January 3 trading day. Shares of the other three major airlines fell as well, though not by as much.
I believe the selloff was overdone, and the market seems to have agreed. Investors who bought the dip were rewarded. From January 3 to January 25, Delta shares recouped about 4.5 percent. Over the same period, the NYSE Arca Airline Index soared about 14.7 percent.
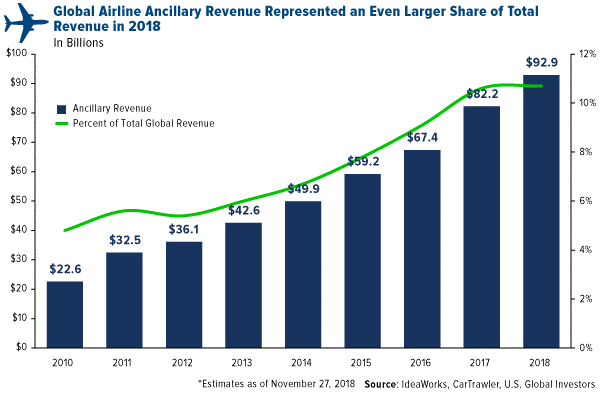
Ancillary Revenues Helped Offset Higher Fuel Costs in 2018
Much of this enthusiasm was driven by better-than-expected full-year and fourth-quarter earnings reports from a number of domestic carriers.
For 2018, United reported an impressive earnings per share (EPS) of $7.70, up 9 percent from 2017. This came even while total fuel costs were 34 percent higher. The carrier is now projecting an EPS of between $10 and $12 this year, based not just on increased demand but also growing ancillary revenue.
As a reminder, “ancillary revenue” includes all non-ticket items such as baggage fees, assigned seating, credit cards, loyalty programs and more. According to consultancy firm IdeaWorks, such fees on a global scale stood at a mind-boggling $92.9 billion in 2018, an increase of 312 percent since 2010. Of that amount, the “big four” U.S. airlines netted close to $27 billion. Taken together, these additional revenues have helped airlines offset rising fuel and labor costs.
Delta said as much in its own earnings report. For 2018, operating revenue was up 8 percent year-over-year to $44 billion “on an increasingly diverse revenue base, with 52 percent of revenues from premium products and non-ticket sources.” The Atlanta-based carrier reported $1 billion in profits in the fourth quarter, an unbelievable increase of 240 percent from the same three months in 2017. That amounted to an EPS of $1.49, compared to $0.42 the previous year.
American also reported stellar earnings, and CEO Doug Parker tantalized the market with exciting guidance for this year. “At the midpoint of our guidance, 2019 diluted earnings per share, excluding special items, would increase approximately 40 percent versus 2018,” Parker said. Shares of American popped as much as 6.4 percent on the news.
10th Straight Year of Profitability?
Despite the recent spike in market volatility, I believe the investment case for global airlines looks favorable going forward. I’m not alone. In a press release dated January 23, Moody’s Investors Service stressed that although economic growth could be slowing worldwide, airlines are well-equipped financially for the next 12 to 18 months. The ratings agency writes that “the global passenger airlines industry is stable on steady operating margins, supported by higher passenger volumes, mixed growth in pricing and modestly lower fuel costs.”
If all goes according to plan in 2019, the global airline industry will have achieved something it’s never managed to do—that is, log 10 consecutive years of profitability. In its 2019 outlook, the International Air Transport Association (IATA) believes this will be the case, with net profits estimated at $35.5 billion, slightly ahead of 2018’s $32.3 billion. “An industry first,” the Geneva-based trade group tweeted on December 27. “2019 forecast to be 10th consecutive year of profitability for the global airline industry.”
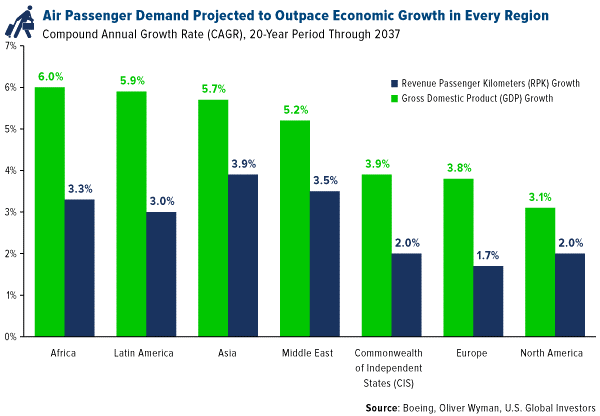
Long-Term Outlook: Air Travel Demand Could Outpace Economic Growth
Looking ahead even further, 10 to 20 years, I think that airlines could be a profitable way to participate in the expansion of incomes around the world. In about a decade, an estimated 200 million people—many of them concentrated in developing countries such as China and India—are expected to join the middle class and, for the first time, be able to afford the cost of airfare, according to a new report by consulting firm Oliver Wyman.
Air travel has historically been tied to change in a country’s or region’s gross domestic product (GDP), but there’s reason to believe that demand will actually outpace economic growth. For the past decade, air passenger traffic growth—as measured in revenue passenger kilometers (RPFs)—has already been faster than GDP growth on an annual basis. Analysts at Boeing now believe this trend will continue for the next 18 years. With a 6 percent compound annual growth rate (CAGR), African countries are projected to undergo the greatest expansion of any other region, followed by Latin America and Asia. Highly developed regions such as Europe and North America will likely see the weakest change year-to-year, but even then, air travel demand growth is expected to be faster than economic growth.
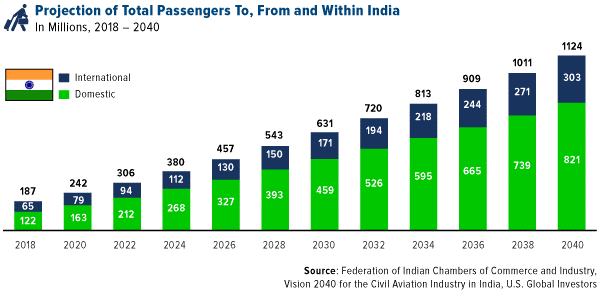
More Than a Billion Indian Passengers by 2040?
For a moment let’s look just at India, currently the second most populous country on earth. One of the world’s fastest growing regions, it’s expected to replace the U.K. this year as the fifth largest economy. According to the Federation of Indian Chambers of Commerce and Industry (FICCI), which hosted the Global Aviation Summit this month in Mumbai, India today has the world’s seventh largest aviation market with 187 million passengers. By 2022, it could be the third largest.
And if the trend continues, India could very well be the largest aviation market in the world with around 1.12 billion passengers flying to, from and within the South Asian country. That’s an incredible sixfold jump from 2018.
To accommodate so many passengers, the fleet size of scheduled airlines would need to expand dramatically. The FICCI believes the number of aircraft in India could swell from 622 in 2018 to as many as 2,360 by 2040.
This, of course, would benefit manufacturers such as Boeing, which FORTUNE just named as the most admired aerospace company in its annual list of the “World’s Most Admired Companies.”
Boeing Just Unveiled Its Self-Driving Air Taxi
The jet maker recently showed off the progress of its planned self-driving air taxi, which it is building in cooperation with ride-hailing company Uber. “Uber Air,” as it’s called, is a battery-operated, autonomously flying vehicle, with a range of about 50 miles. Morgan Stanley Research estimates that the market for “autonomous urban aircraft” could be as large as $1.5 trillion by 2040. Boeing, which is projected to have a 40 percent market share of all aircraft by 2025, is well-positioned to take the lead in this exciting new technology.
The S&P 500 Index (Standard & Poor's 500 Index) is a market-capitalization-weighted. index of the 500 largest U.S. publicly traded companies by market value, The index is widely regarded as the best single gauge of large-cap U.S. equities. The NYSE Arca Airline Index is a rules-based index designed to measure the performance of highly capitalized companies in the airline industry.
Ancillary fees/revenue, in the airline industry, is revenue from non-ticket sources, such a baggage fees and on-board food and services, and has become an important financial component for low-cost carriers. Diluted earnings per share (EPS) is a calculation used to gauge the quality of a company's EPS if all convertible securities were exercised. Operating margin measures how much profit a company makes on a dollar of sales, after paying for variable costs of production such as wages and raw materials, but before paying interest or tax. It is calculated by dividing a company's operating profit by its net sales. The compound annual growth rate (CAGR) is the rate of return that would be required for an investment to grow from its beginning balance to its ending balance assuming the profits were reinvested at the end of each year of the investment's lifespan. Revenue passenger miles (RPMs) and revenue passenger kilometers (RPKs) are measures of traffic for an airline flight, bus, or train calculated by multiplying the number of revenue-paying passengers aboard the vehicle by the distance traveled. The FORTUNE World’s Most Admired Companies study surveys top executives and directors from eligible companies, along with financial analysts, to identify the companies that enjoy the strongest reputations within their industries and across industries.
Holdings may change daily. Holdings are reported as of the most recent quarter-end. The following securities mentioned in the article were held by one or more accounts managed by U.S. Global Investors as of 12/31/2018: American Airlines Group Inc., Delta Air Lines Inc., United Continental Holdings Inc., Southwest Airlines Co., The Boeing Co.
All opinions expressed and data provided are subject to change without notice. Some of these opinions may not be appropriate to every investor. By clicking the link(s) above, you will be directed to a third-party website(s). U.S. Global Investors does not endorse all information supplied by this/these website(s) and is not responsible for its/their content.
U.S. Global Investors, Inc. is an investment adviser registered with the Securities and Exchange Commission ("SEC"). This does not mean that we are sponsored, recommended, or approved by the SEC, or that our abilities or qualifications in any respect have been passed upon by the SEC or any officer of the SEC.
This commentary should not be considered a solicitation or offering of any investment product.
Certain materials in this commentary may contain dated information. The information provided was current at the time of publication.
*********
 Frank Holmes is the CEO and Chief Investment Officer of U.S. Global Investors. Mr. Holmes purchased a controlling interest in U.S. Global Investors in 1989 and became the firm’s chief investment officer in 1999. Under his guidance, the company’s funds have received numerous awards and honors including more than two dozen Lipper Fund Awards and certificates. In 2006, Mr. Holmes was selected mining fund manager of the year by the Mining Journal. He is also the co-author of “The Goldwatcher: Demystifying Gold Investing.” Mr. Holmes is engaged in a number of international philanthropies. He is a member of the President’s Circle and on the investment committee of the International Crisis Group, which works to resolve conflict around the world. He is also an advisor to the William J. Clinton Foundation on sustainable development in countries with resource-based economies. Mr. Holmes is a native of Toronto and is a graduate of the University of Western Ontario with a bachelor’s degree in economics. He is a former president and chairman of the Toronto Society of the Investment Dealers Association. Mr. Holmes is a much-sought-after keynote speaker at national and international investment conferences. He is also a regular commentator on the financial television networks CNBC, Bloomberg and Fox Business, and has been profiled by Fortune, Barron’s, The Financial Times and other publications. Visit the U.S. Global Investors website at http://www.usfunds.com.
More from Silver Phoenix 500


