Fear And Greed In The Silver Market
London (Sept 15) Fear and greed and two of the strongest human emotions. Most traders and investors experience fear and greed, which often drives behavior. Fear is one of the primary reasons that market participants scurry to exit markets when time get tough. Greed often keeps them in risk positions long after the risk-reward profile shifts.
One of the best ways to avoid losing money as a result of fear and greed is to approach a market with a plan. Knowing how much capital you are willing to risk and what the profit target should be is a rational way to keep fear and greed in check.
The more volatile assets tend to move higher and lower when they evoke fear and greed. Silver is a market that tends to move on the market's overall sentiment. Therefore, fear and greed are always lurking in the precious metal. Silver volatility tends to be 50% higher than gold price variance. Since the final week of May, the price of silver moved from $14.245 to a high at $19.54 per ounce on the continuous COMEX contract, and $19.75 on the active month December futures. Those who bought silver early, likely felt like they were riding a cash machine in the precious metal. Those who bought late and were looking for silver to burst through $20 per ounce were guided by greed. Now that silver has pulled back to under $17.50, fear could be creeping back, and if the price of the metal moves lower over the coming sessions, the emotion will intensify.
Many market participants wind up buying when they should be selling and vice versa. I believe that the current correction in the silver market will lead to a buying opportunity at a higher low. Volatility is a curse for some, but for nimble traders with their fingers on the pulse of markets like silver, it can be a paradise of profits. The Velocity Shares 3X Long Silver ETN product (USLV) can be an excellent short-term tool in the silver market, but it intensifies fear and greed. Price and time stops are necessary when using triple-leveraged products because the prices routinely explode and implode.
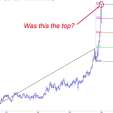
Silver lagged, but took off and almost reached $20 at the end of the gold rally
The gold market had traded in a $331.30 range from 2014 through June 2019 with the low at $1046.20 in December 2015 and the high at $1377.50 in July 2016.
As the monthly chart shows, gold broke out to the upside in June as the price rose above the July 2016 high and reached the highest level since 2013. The move in the yellow metal came after the US Federal Reserve told markets that the Fed Funds rate would decline by the end of 2019. Gold reached a high at $1559.80 during the first week of September. While gold broke out in June, silver could not even make it to a new high for 2019 during the same month
As the weekly chart illustrates, silver's high in June was at $15.555, which was below the early 2019 peak at $16.20 per ounce. In July, silver finally moved to a new high for this year, but it was not until August that the price rose above the 2018 peak and next level of technical resistance at $17.7050. In early September, silver moved above the 2017 high at $18.655. Silver climbed to $19.54 in early September, but the critical resistance level at the July 2016 high at $21.095 remained elusive.
On September 13, gold was at just over the $1490 level on the December futures contract with silver at around $17.485. A correction was overdue after the trajectory of the price moves in both of the precious metals.
The silver/gold ratio fell from the recent high
The silver/gold ratio is a metric that has been around since the first Egyptian Pharaoh Menes declared that two and one-half parts silver equal one-part gold. Both of the precious metals have long histories as a means of exchange or hard currencies. When compared to fiat currencies, gold has been most analogous with banknotes and silver as change or coinage.
Since the 1970s, the silver/gold ratio or the metric that represents the price of gold divided by the price of silver has made higher lows during bull market periods.
The chart of the metric dating back to 1974 shows that the bull market in 1979/1980 drove the ratio to a low at 15.47:1 and in 2011 when both metals hit highs it fell to a higher low at just over 38:1. The high in 1990 on the quarterly chart took it to the 93.18:1 level, so the average over the past four and one-half decades stands at around the 55:1 level.
The weekly chart dating back to 1991 shows that the price relationship hit a peak at 101.42:1. While the ratio rose above the 1990 high on the quarterly chart when it reached 93.73:1 in early July of this year, it remained below the peak from almost thirty years ago.
Perhaps the most significant factor that has led to the long-term trend of a higher silver/gold ratio has been that central banks around the world continue to hold gold as a reserve asset, while silver's role in that regard has diminished. The days of silver standards or even coins made of silver have faded into history, and these days silver is both a precious and an industrial metal. Gold remains the ultimate hard currency, but the price action in the silver market in July and August were another sign that rising gold prices have a magnetic effect on silver.
The daily chart of December gold divided by December silver futures shows that after reaching a peak at 93.39:1 on July 5, the ratio fell to a low at 79.31:1 on September 4 when the two metals hit the most recent highs. The price corrections took the ratio back to around the 85:1 level at the end of last week.
Silver falls below the $18 level
After hitting a peak at $19.75 per ounce on September 4, the price of silver corrected fell below the $18 per ounce level.
The daily chart of December futures shows that the price dropped quickly with the bulk of the move coming on September 5 and 6 and again on Friday, September 12. Price momentum and relative strength metrics have moved lower from overbought conditions and were below neutral at the end of last week. After moving to almost the 240,000-contract level at the end of August, the total number of open long and short positions in the COMEX silver futures market declined to just over 218,000 contracts as of September 12. The wider daily trading ranges pushed daily historical volatility from under 16% in mid-August to over 40% at the end of last week. December silver is approaching the $17.50 per ounce level, and while it could still move lower over the coming days and weeks as the correction continues, the odds of new highs and a challenge of the July 2016 peak and level of critical technical resistance remain high.
The reason for a higher low in silver
A 50% retracement of the move from the late May 2019 low at $14.47 to the September peak at $19.75 stands at $17.11 per ounce. Silver has room on the downside before the price action is looking overly bearish again. Moreover, since silver has a habit of violating technical levels at times, it is always possible that a head fake move to below $17 can occur before the price makes a higher low. However, there is a compelling reason why silver is now in a bull market that will take the price above the July 2016 highs over the coming weeks and months.
The world's central banks have accelerated the money printing business. The past eleven years following the global financial crisis have ushered in a new era of economic stimulus via historically low short-term interest rates and quantitative easing or purchasing debt instruments to push down interest rates further out along the yield curve. The US Fed attempted to tighten credit and reverse the trend from December 2015 through the end of 2018. The world's leading central bank increased the Fed Funds rate from zero to 2.25-2.50% and reduced their swollen balance sheet to put upward pressure on longer-term rates. However, other central banks around the world did not follow the Fed's lead out of accommodative monetary policy as they had followed them into the strategy. In a sign that the central banks of the world are addicted to stimulus, the Fed reversed course in 2019 by ending their balance sheet normalization program and cutting the Fed Funds rate for the first time in years on July 31. Last week, the European Central Bank cut short-term rates by ten basis points to a new record low at negative 50 points. At the same time, the ECB said they would rev up the printing presses again to the tune of 20 billion euros of quantitative easing per month starting in November. This coming week, we will hear from the US Fed, and the FOMC is likely to cut rates by another 25 basis points.
The bottom line is that falling rates, over a decade of stimulus, and addiction to printing fiat currency devalues all of the foreign exchange instruments around the globe. The trend of decline in the value of the dollar, euro, pound, yen, yuan, and all world currencies against gold, could be the most bullish factor for the gold and silver markets over the coming weeks, months, and perhaps years. The bill for stimulus is lower currency values. While central banks can print legal tender to their heart's content, gold and silver supplies come from the crust of the earth. The central banks cannot press any magic buttons to increase the supply of both precious metals. Therefore, I believe the current dip in the silver and gold markets is another buying opportunity, and higher prices are on the horizon, but it could be a bumpy ride.
SeekingAlpha