Gold: Consolidation or Trend Change? Primary tabs
NEW YORK (May 25) The combination of high inflation and recessionary fears have provided the perfect macroeconomic conditions for gold to perform in recent months. Since October of last year, the yellow metal staged an impressive 30% rally before peaking in early May. It has subsequently dropped to lower daily lows as investors take profits and take stock of the current economic picture.
The question on the minds of gold investors now is whether more upside is in store, or whether something has changed in the broader economy that will be a headwind to gold prices going forward. Gold has certainly been fulfilling its role as an inflation hedge, safe haven, and hedge against the financial system of late. The focus now is on what combination of conditions and central bank reactions we are likely to see throughout the rest of the year, and how these will influence sentiment around the precious metal.
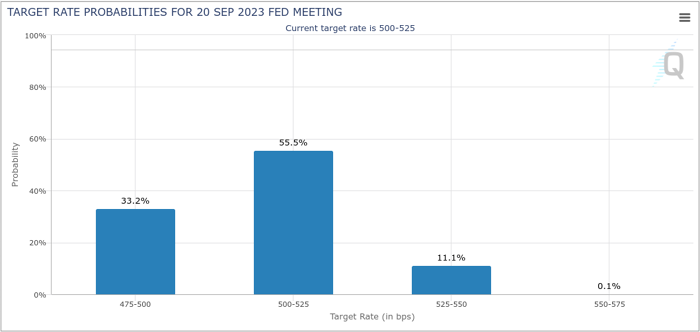
At the end of April, the CME’s FedWatch tool was predicting rate cuts to begin as early as July of 2023. This picture has subsequently changed with the possibility of the first cut now showing up in September of this year.
Fed Pivots
Perhaps the best-case scenario for gold investors would be that the Federal Reserve does opt to cut interest rates at some point in 2023. This would be positive for gold because it tends to perform better in lower rate environments. A pivot in policy also confirms the recessionary fears that are already contributing to higher gold prices. This is because the Federal Reserve is unlikely to cut rates unless it’s forced to. If the Fed is forced to pivot with inflation still above its target, this could provide further fuel to the gold rally.
Currently, the CME’s FedWatch tool is forecasting a 35% chance of the Fed’s first rate cut occurring in September of 2023.
Fed Keeps Hiking
Alternatively, the Fed continuing to raise rates in the face of a possible recession could weigh on gold prices, even though it would certainly mean that inflation is still too high. This is due to the opportunity cost associated with holding a non-yield-bearing asset in a higher rate environment. It also means that the economic data coming out of the US proves to be more resilient than expected as the Fed is unlikely to shock markets with a hike unless it feels the move is warranted by the data.
This is probably the most unlikely scenario because as US economic data begins to show signs of softening, the Fed’s language is already seems converging upon a wait-and-see approach in which it pauses rate hikes from the next FOMC meeting onwards and then observes the economy for the lagging effects of its hawkish policy.
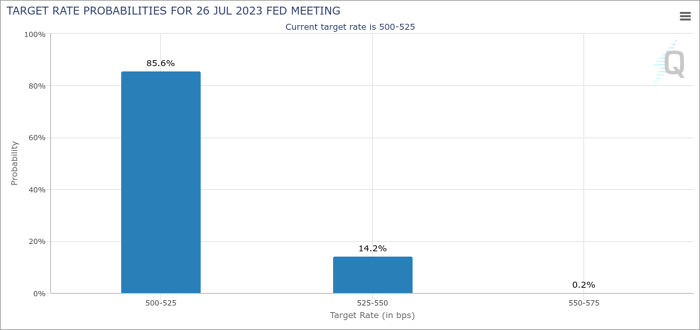
The CME’s FedWatch tool is currently predicting an 85% chance of a pause at the FOMC meeting in July.
Fed Pauses
A pause, while perhaps better for gold than outright rate hikes (especially if inflation remains elevated as the economic data continue to deteriorate), may support gold in the short-term but can still be bearish for gold in the longer-term. This is because it opens up the possibility of a soft- or no-landing scenario in which rates remain high for longer with no further hikes or outside shocks leading to a pivot. This would allow inflation to moderate and perhaps even economic conditions to improve, which will be bearish for gold.
With a pause currently the most likely of the three scenarios, following US economic data leading into the July meeting will be crucial as it will provide more information regarding the rate at which inflation is easing, as well as a clearer picture as to the health of the US consumer and employment landscape.
Yield curve inversions have proven to be reliable indications of impending recessions. The yield curve between 2-year and 10-year treasuries inverted in March of 2022. Historically, inversions precede recessions by between six and twenty-four months, which puts those September rate cut expectations into context and tells markets that one way or another we should have some clarity by the end of the year.
Key Levels
After peaking on May 4, gold has subsequently come down to set a daily lower-low at $1,954 on May 18. It now appears to be retesting the bottom of its recent trading range from below as resistance at around $1,980. Should it fail to break back into this range between $1980 and $2,050 there are several key support levels to keep track of.
Firstly, we have the 20-week moving average, currently at around $1,940. This almost lines up with the 50-day MA (orange line), currently at around $1,934, and February’s high at around $1950.
FXEmpire


